Setting up R Packages
Plot Theme
Show the Code
# https://stackoverflow.com/questions/74491138/ggplot-custom-fonts-not-working-in-quarto

# Chunk options
knitr::opts_chunk$set(
  fig.width = 7,
  fig.asp = 0.618, # Golden Ratio
  # out.width = "80%",
  fig.align = "center"
)
### Ggplot Theme
### https://rpubs.com/mclaire19/ggplot2-custom-themes

theme_custom <- function() {
  font <- "Roboto Condensed" # assign font family up front

  theme_classic(base_size = 14) %+replace% # replace elements we want to change

    theme(
      panel.grid.minor = element_blank(), # strip minor gridlines
      text = element_text(family = font),
      # text elements
      plot.title = element_text( # title
        family = font, # set font family
        size = 16, # set font size
        face = "bold", # bold typeface
        hjust = 0, # left align
        # vjust = 2                #raise slightly
        margin = margin(0, 0, 10, 0)
      ),
      plot.subtitle = element_text( # subtitle
        family = font, # font family
        size = 14, # font size
        hjust = 0,
        margin = margin(2, 0, 5, 0)
      ),
      plot.caption = element_text( # caption
        family = font, # font family
        size = 8, # font size
        hjust = 1
      ), # right align

      axis.title = element_text( # axis titles
        family = font, # font family
        size = 10 # font size
      ),
      axis.text = element_text( # axis text
        family = font, # axis family
        size = 8
      ) # font size
    )
}

# Set graph theme
theme_set(new = theme_custom())
#
Introduction
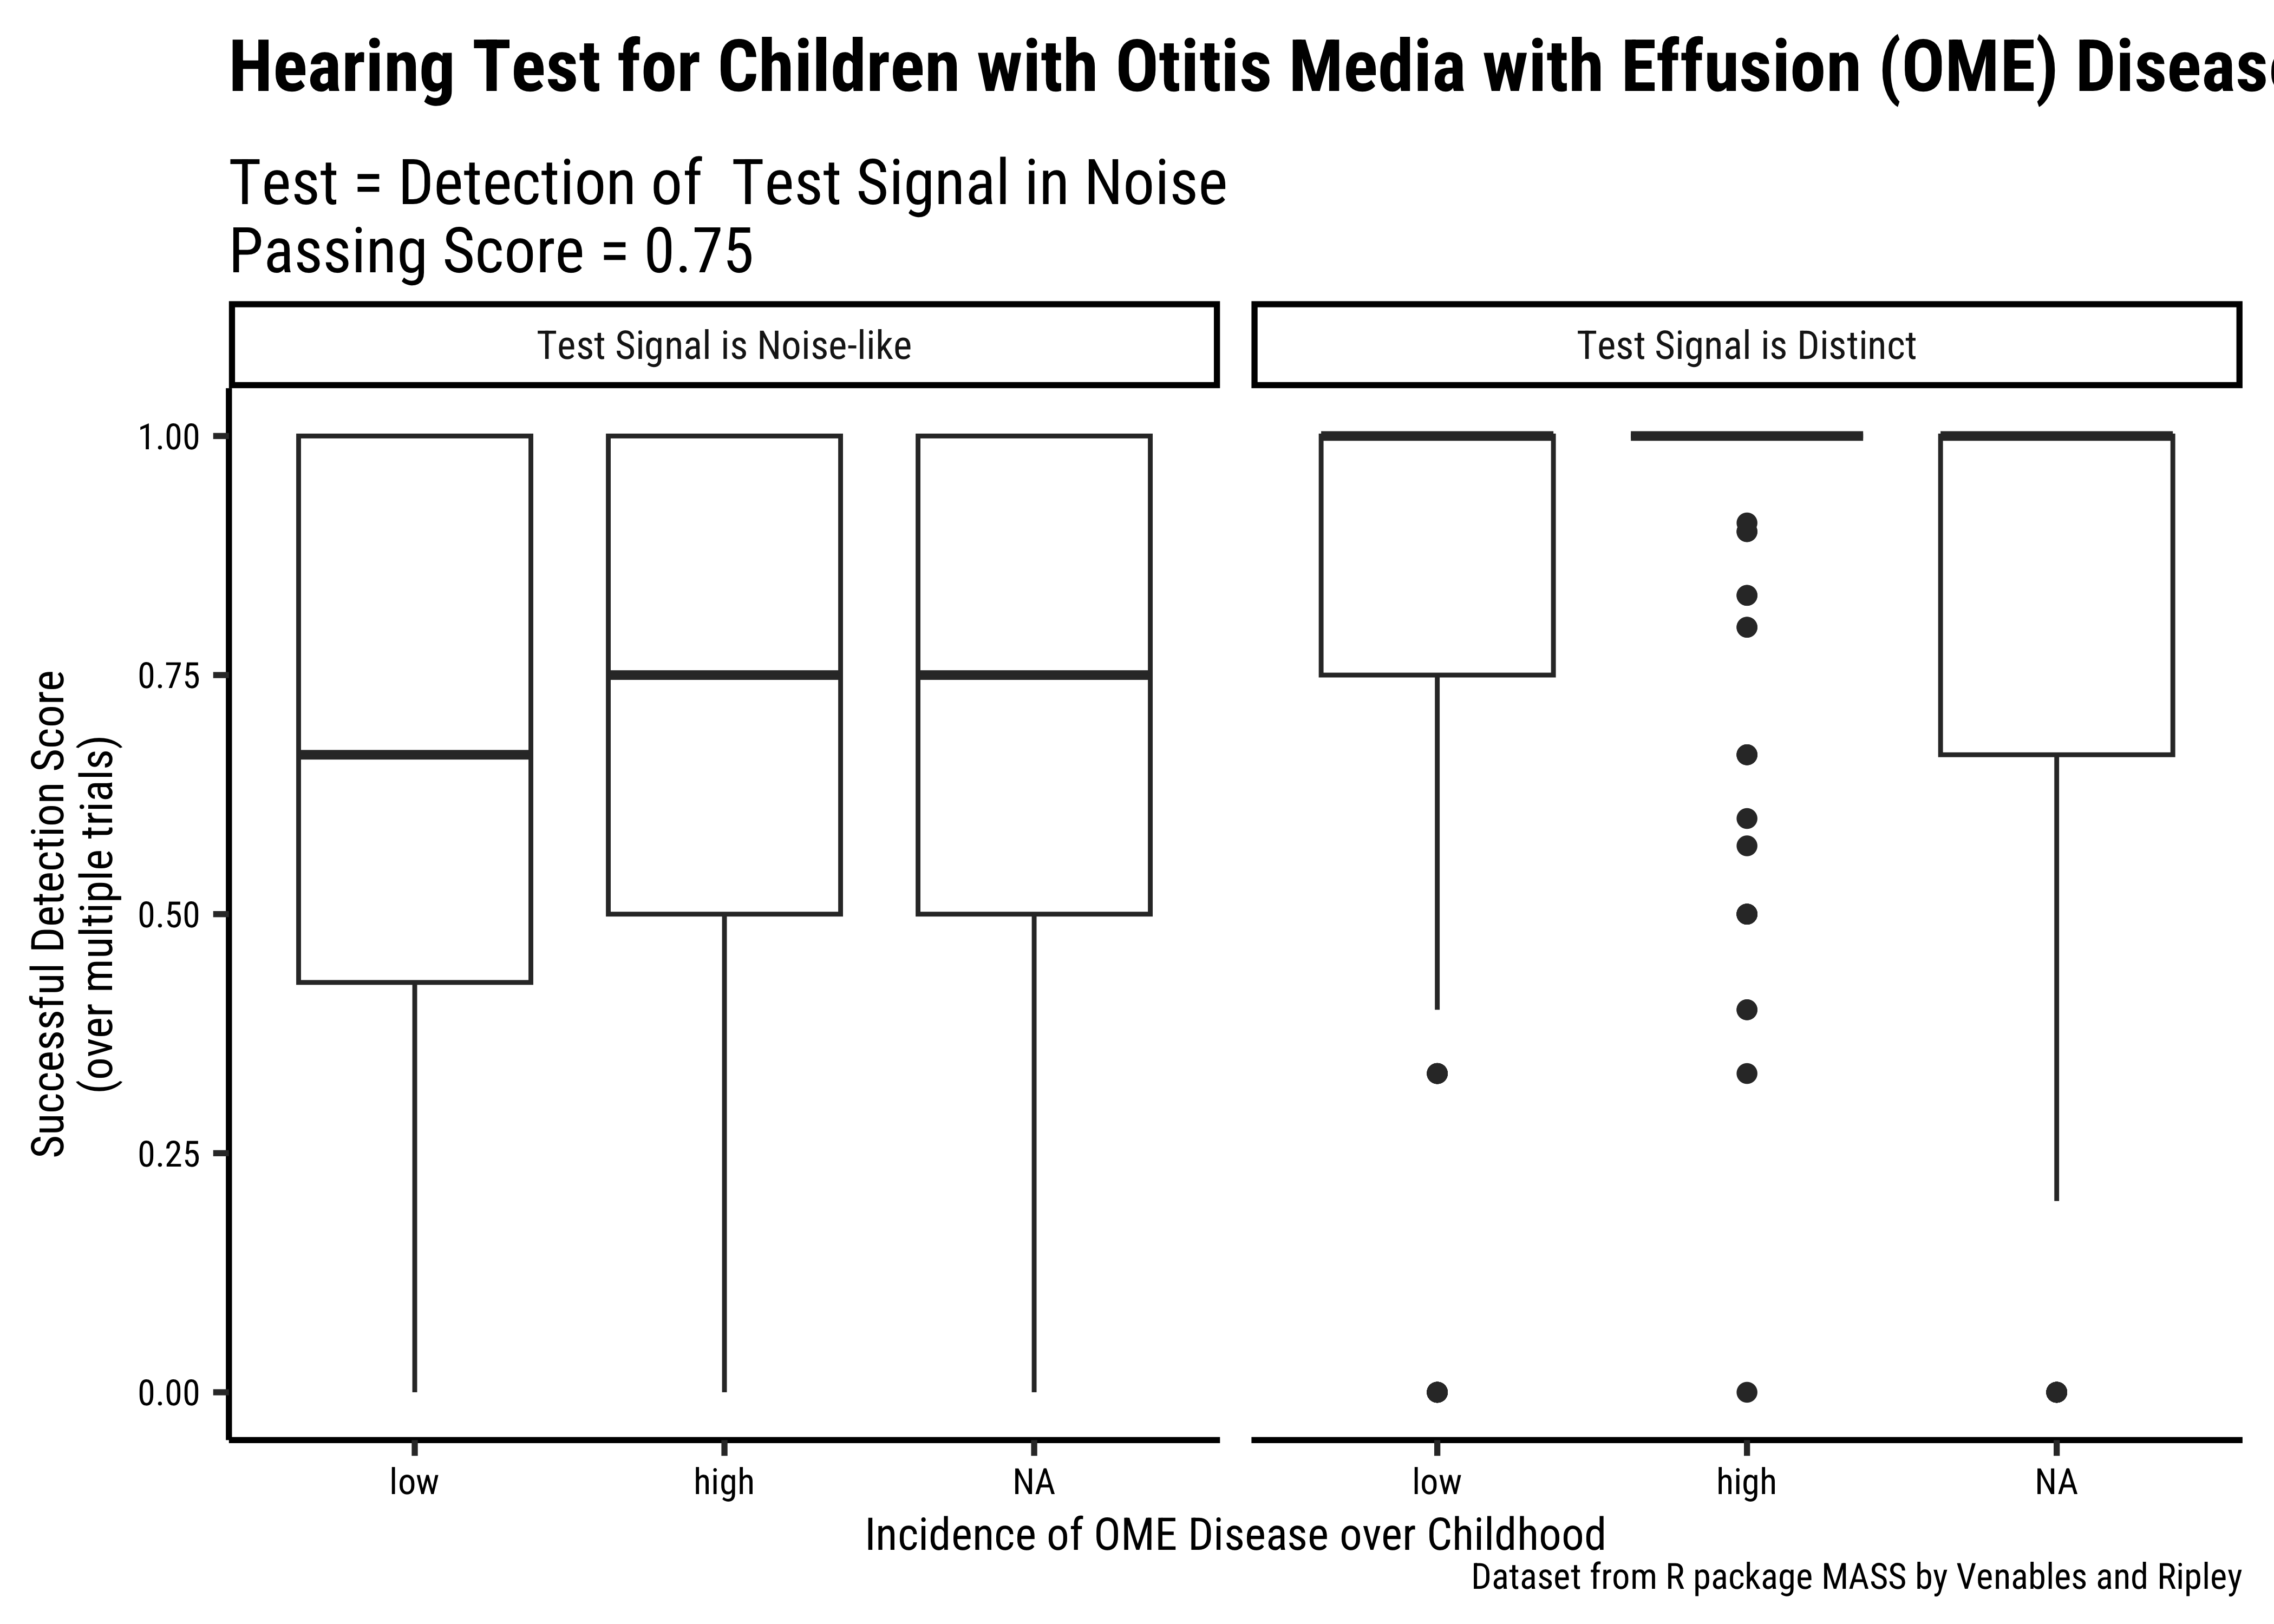
Children are monitored for OME (Otitis Media with Effusion, i.e. fluid in the middle ear) over time. It is believed that they later ( i.e. during aduldhood) suffer from “binaural hearing loss” (detecting sound amplitude and direction) after past episodes of OME during their childhood. The hearing-test is conducted multiple times, with a Test Signal embedded in noise played over audio loudspeakers. One loudspeaker has only Noise, and the other loudspeaker has the Test Signal in Noise. There are also two types of Test Signals: one is like noise itself and the other is distinct. In any test round, children are expected to orient themselves towards the appropriate loudspeaker and detect the presence of the Test Signal at varying levels of volume, with a passing success rate of 75% over multiple tests.
This dataset is available on Vincent Arel-Bundock’s dataset repository and is a part of the R package MASS.
Read the Data
Rows: 1,097
Columns: 8
$ rownames <dbl> 1, 2, 3, 4, 5, 6, 7, 8, 9, 10, 11, 12, 13, 14, 15, 16, 17, 18…
$ ID       <dbl> 1, 1, 1, 1, 1, 1, 1, 1, 1, 1, 1, 1, 1, 1, 1, 1, 1, 1, 1, 1, 3…
$ Age      <dbl> 30, 30, 30, 30, 30, 30, 30, 30, 30, 30, 60, 60, 60, 60, 60, 6…
$ OME      <chr> "low", "low", "low", "low", "low", "low", "low", "low", "low"…
$ Loud     <dbl> 35, 35, 40, 40, 45, 45, 50, 50, 55, 55, 35, 35, 40, 40, 45, 4…
$ Noise    <chr> "coherent", "incoherent", "coherent", "incoherent", "coherent…
$ Correct  <dbl> 1, 4, 0, 1, 2, 2, 3, 4, 3, 2, 2, 3, 1, 1, 1, 5, 4, 2, 3, 4, 4…
$ Trials <dbl> 4, 5, 3, 1, 4, 2, 3, 4, 3, 2, 4, 4, 4, 1, 2, 5, 4, 2, 3, 4, 6…omerownames <dbl> | ID <dbl> | Age <dbl> | OME <chr> | Loud <dbl> | Noise <chr> | Correct <dbl> | Trials <dbl> |
|---|---|---|---|---|---|---|---|
| 1 | 1 | 30 | low | 35 | coherent | 1 | 4 |
| 2 | 1 | 30 | low | 35 | incoherent | 4 | 5 |
| 3 | 1 | 30 | low | 40 | coherent | 0 | 3 |
| 4 | 1 | 30 | low | 40 | incoherent | 1 | 1 |
| 5 | 1 | 30 | low | 45 | coherent | 2 | 4 |
| 6 | 1 | 30 | low | 45 | incoherent | 2 | 2 |
| 7 | 1 | 30 | low | 50 | coherent | 3 | 3 |
| 8 | 1 | 30 | low | 50 | incoherent | 4 | 4 |
| 9 | 1 | 30 | low | 55 | coherent | 3 | 3 |
| 10 | 1 | 30 | low | 55 | incoherent | 2 | 2 |
Data Dictionary
Write in.
Write in.
Write in.
Research Question
In hearing tests on people with varying levels of OME infection in their childhood, what is the effect of using distinct types of Test Signal on successful (face) orientation ?
Analyse/Transform the Data
```{r}
#| label: data-preprocessing
#
# Write in your code here
# to prepare this data as shown below
# to generate the plot that follows
# Rename Variables if needed
# Change data to factors etc.
# Set up Counts, histograms etc
```rownames <dbl> | ID <fct> | Age <fct> | OME <ord> | Loud <fct> | Noise <fct> | Correct <dbl> | Trials <dbl> | success_rate <dbl> |
|---|---|---|---|---|---|---|---|---|
| 1 | 1 | 30 | low | 35 | Test Signal is Noise-like | 1 | 4 | 0.2500000 |
| 2 | 1 | 30 | low | 35 | Test Signal is Distinct | 4 | 5 | 0.8000000 |
| 3 | 1 | 30 | low | 40 | Test Signal is Noise-like | 0 | 3 | 0.0000000 |
| 4 | 1 | 30 | low | 40 | Test Signal is Distinct | 1 | 1 | 1.0000000 |
| 5 | 1 | 30 | low | 45 | Test Signal is Noise-like | 2 | 4 | 0.5000000 |
| 6 | 1 | 30 | low | 45 | Test Signal is Distinct | 2 | 2 | 1.0000000 |
| 7 | 1 | 30 | low | 50 | Test Signal is Noise-like | 3 | 3 | 1.0000000 |
| 8 | 1 | 30 | low | 50 | Test Signal is Distinct | 4 | 4 | 1.0000000 |
| 9 | 1 | 30 | low | 55 | Test Signal is Noise-like | 3 | 3 | 1.0000000 |
| 10 | 1 | 30 | low | 55 | Test Signal is Distinct | 2 | 2 | 1.0000000 |
Plot the Data
Task and Discussion
- Complete the Data Dictionary.
- Select and Transform the variables as shown.
- Create the graphs shown and discuss the following questions:
- Identify the type of charts
- Identify the variables used for various geometrical aspects (x, y, fill…). Name the variables appropriately.
- What research activity might have been carried out to obtain the data graphed here? Provide some details.
- What pre-processing of the data was required to create the chart?
- Write a 2-line story based on the chart, describing your inference/surprise. Is there something counter-intuitive (to a lay person) in the chart?