Data Analytics for Managers and Creators
Using R for Data Visualization, Analysis, and Inference

It is a truth universally acknowledged, that a Srishti Art and Design student, in possession of a good Mac, must be terrified of coding.
-Code and Prejudice, Jane Austen, 1813
Abstract
This Course takes Business Practitioners and Design Peasants on a journey of Data Analytics: using data to derive insights, make predictions, and decide on plans of action that can be communicated and actualized in a Design and Business context.
“Business analytics, or simply analytics, is the use of data, information technology, statistical analysis, quantitative methods, and mathematical or computer-based models to help managers gain improved insight about their business operations and make better, fact-based decisions. Business analytics is”a process of transforming data into actions through analysis and insights in the context of organizational decision making and problem solving”
— Libertore and Luo, 2010
The Course starts with Descriptive Analytics: Datasets from various domains of business, design, and scientific activity are introduced. The datasets are motivated from the point of view of the types of information they contain: students will relate the Data Variables (Qualitative and Quantitative) to various types of Data/Information Visualizations.
Statistical Concepts such as Sampling, Hypothesis Tests, Simulation / Modelling, and Uncertainty will be introduced.
Predictive Analytics will take us into looking at Data and training standard ML algorithms to make predictions with new Data. Regression, Clustering, and Classification will be covered.
Prescriptive Analytics will deal with coming to terms with the uncertainty in Predictions, and using tools such as both ML, Linear/non-Linear Programming, and Decision-Making to make Business Decisions, with an assessment of the Risks involved.
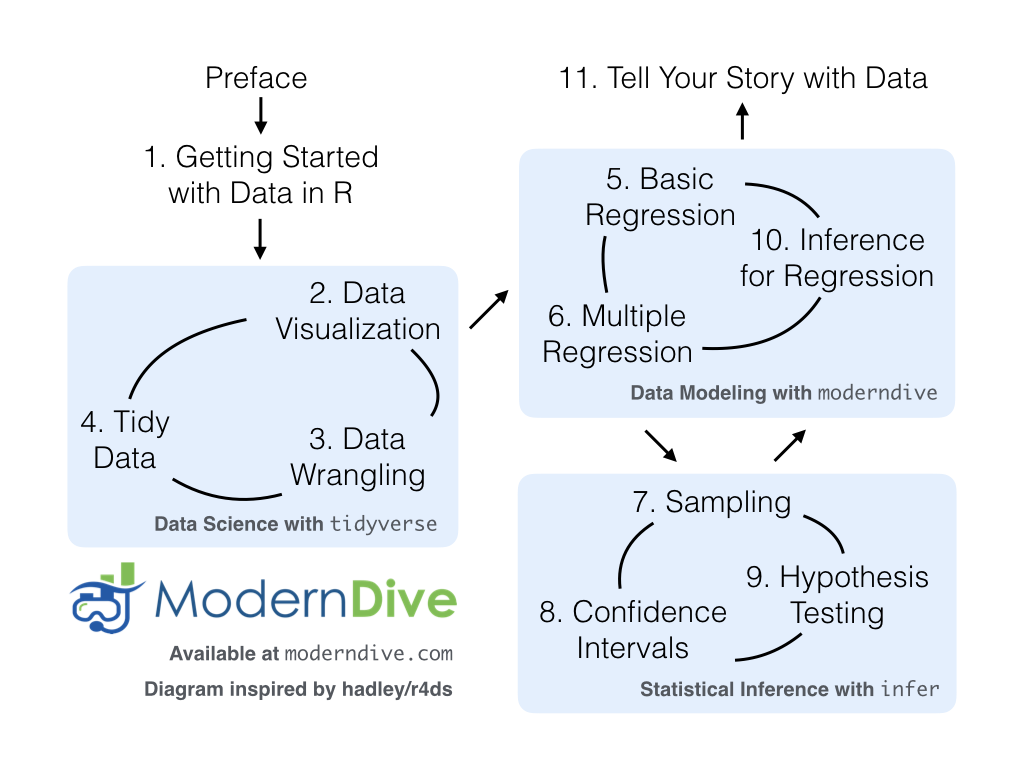
The Course will include in a full Data Analytics Workflow that includes Data Gathering and Cleaning, Descriptive and Predictive Analytics, Prescriptive Analytics and Decision Making, and Communication resulting in a publication-worthy documents (HTML / PDF/ Word) and/or on your own website.
A diagram from a very popular textbook by Ismay and Kim may be relevant here:
What you will learn
- Data Basics: What does data look like and why should we care?
- Understand the R language, and appreciate how close it is t plain English, for the most part
- Rapidly and intuitively creating Graphs and Data Visualizations using geometric metaphors to explore data for insights
- Use Statistical Tests, Procedures, Models, and Simulations and to answer Business and Design Questions
- Using ML algorithms such Regression, Classification, and Clustering to develop Business Insights
- Use Linear Programming to make Business Decisions
- Create crisp and readable Reports that can be shared in a Business Context
References
Visualization and R language
- Hadley Wickham, Mine Cetinkaya-Rundel, and Garett Grolemund. R for Data Science (2e). https://r4ds.hadley.nz. The most important reference for data visualization and analysis in R. Available free online.
- Robert Kabacoff. Modern Data Visualization with R. https://rkabacoff.github.io/datavis/. Available free online.
- Jack Dougherty and Ilya Ilyankou, Hands-On Data Visualization: Interactive Storytelling from Spreadsheets to Code, https://handsondataviz.org/. Available free online.
- Claus O. Wilke, Fundamentals of Data Visualization, https://clauswilke.com/dataviz/. Available free online.
- Jonathan Schwabish, Better Data Visualizations: A Guide for Scholars, Researchers, and Wonks, Columbia University Press, 2021.
- Alberto Cairo, The Functional Art: An introduction to information graphics and visualization, New Riders. 2013. ISBN-9780133041361. 1.. Cole Nussbaumer Knaflic, Storytelling With Data: A Data Visualization Guide for Business Professionals, Wiley 2015. ISBN-9781119002253.
Analytics
- James R Evans, Business Analytics: Methods, Models, and Decisions, Pearson Education, 2021.
- Judd, C.M., McClelland, G.H., & Ryan, C.S. (2017). Data Analysis: A Model Comparison Approach To Regression, ANOVA, and Beyond, Third Edition (3rd ed.). Routledge. https://doi.org/10.4324/9781315744131
- Thomas Maydon, The 4 Types of Data Analytics, https://www.kdnuggets.com/2017/07/4-types-data-analytics.html
- Dimitris Bertsimas, Robert Freund, Data, Models, and Decisions: the Fundamentals of Management Science, Dynamic Ideas Press, 2004.
- Cliff T. Ragsdale, Spreadsheet Modeling & Decision Analysis: A Practical Introduction to Management Science, South Western, Cengage Learning, Mason, OH, 2012.
- Keith McNulty. Handbook of Regression Modeling in People Analytics: With Examples in R, Python and Julia https://peopleanalytics-regression-book.org. Available free online.
Statistics
- Mine Cetinkaya-Rundel, Johanna Hardin. Introduction to Modern Statistics. https://openintro-ims2.netlify.app. Available free online.
- Daniel T. Kaplan. Statistical Models (second edition). https://dtkaplan.github.io/SM2-bookdown/. Available free online.
- Daniel T. Kaplan, Compact Introduction to Classical Inference, 2020. https://dtkaplan.github.io/CompactInference/. Available free online.
- Daniel T. Kaplan and Frank Shaw, Statistical Modeling: Computational Technique. https://www.mosaic-web.org/go/SM2-technique/. Available free online.
- Jonas Kristoffer Lindeløv. Common statistical tests are linear models (or: how to teach stats). https://lindeloev.github.io/tests-as-linear/. Available free online.
Pedagogical Notes
Why this course is what it is, and why it does what it does! Only if you are planning to be an educator yourself!!
PRIMM
The method followed will be based on PRIMM:
- PREDICT: Inspect the code and guess at what the code might do, write predictions
- RUN: the code provided and check what happens
- INFER: what the parameters of the code do and write comments to explain. What bells and whistles can you see?
- MODIFY: the parameters code provided to understand the options available. Write comments to show what you have aimed for and achieved.
- MAKE: take an idea/concept of your own, and graph it.

So in this course, wherever you see “YOUR TURN”, please respond with questions of the data, explanations, more questions and if you are already confident, code chunks to create new calculations and graphs.
And why teach R in this way?
Because we all know two things:
Let us hear from Amelia McNamara:
Our Tools
This is eventually meant to be a three many-in-one course, based on the following free and open source tools:
R https://cran.r-project.org/ and RStudio https://posit.co/
R is a freely available language and environment for statistical computing and graphics which provides a wide variety of statistical and graphical techniques: linear and nonlinear modelling, statistical tests, time series analysis, classification, clustering,etc. RStudio is an integrated development environment (IDE) for R and Python.
Orange Data Mining https://orangedatamining.com/
Orange is also a FOSS visual point-and-click software for Data Mining and ML, developed at the University of Slovenia, in Ljubljana, Slovenia.
Radiant – Business analytics using R and Shiny https://radiant-rstats.github.io/docs/index.html
Radiant is a FOSS platform-independent browser-based interface for business analytics in R, developed at the University of San Diego. The application is based on the Shiny package and can be run using R, or in your browser with no installation required. The tool automatically installs a version of R and adds a Shiny-based GUI that removes the need to write R-code. Radiant can also be installed on top of an existing installation of R and invoked from within RStudio.
Learning R with AI
Of course.
Business Analytics Courses elsewhere
- University of San Diego, Rady School of Business. http://lab.rady.ucsd.edu/sawtooth/business_analytics_in_r/index.html
Modules
| Title | Date | |
|---|---|---|
|
Tools and Software | Dec 31, 2022 |
|
Descriptive Analytics | Dec 31, 2022 |
|
Statistical Inference | Nov 30, 2022 |

|
Inferential Modelling | Apr 13, 2023 |

|
Predictive Analytics | Dec 31, 2022 |

|
Prescriptive Analytics | Dec 31, 2022 |

|
Workflow | Feb 9, 2022 |

|
Case Studies | Sep 2, 2024 |

|
Using AI in Analytics | Jun 29, 2025 |