Applied Metaphors: Learning TRIZ, Complexity, Data/Stats/ML using Metaphors
  1. Teaching
  2. Data Analytics for Managers and Creators
  3. Case Studies
  4. Legionnaire’s Disease in the USA
  • Teaching
    • Data Analytics for Managers and Creators
      • Tools
        • Introduction to R and RStudio
        • Introduction to Radiant
        • Introduction to Orange
      • Descriptive Analytics
        • Data
        • Summaries
        • Counts
        • Quantities
        • Groups
        • Densities
        • Groups and Densities
        • Change
        • Proportions
        • Parts of a Whole
        • Evolution and Flow
        • Ratings and Rankings
        • Surveys
        • Time
        • Space
        • Networks
        • Experiments
        • Miscellaneous Graphing Tools, and References
      • Statistical Inference
        • 🧭 Basics of Statistical Inference
        • 🎲 Samples, Populations, Statistics and Inference
        • Basics of Randomization Tests
        • 🃏 Inference for a Single Mean
        • 🃏 Inference for Two Independent Means
        • 🃏 Inference for Comparing Two Paired Means
        • Comparing Multiple Means with ANOVA
        • Inference for Correlation
        • 🃏 Testing a Single Proportion
        • 🃏 Inference Test for Two Proportions
      • Inferential Modelling
        • Modelling with Linear Regression
        • Modelling with Logistic Regression
        • 🕔 Modelling and Predicting Time Series
      • Predictive Modelling
        • 🐉 Intro to Orange
        • ML - Regression
        • ML - Classification
        • ML - Clustering
      • Prescriptive Modelling
        • 📐 Intro to Linear Programming
        • 💭 The Simplex Method - Intuitively
        • 📅 The Simplex Method - In Excel
      • Workflow
        • Facing the Abyss
        • I Publish, therefore I Am
      • Case Studies
        • Demo:Product Packaging and Elderly People
        • Ikea Furniture
        • Movie Profits
        • Gender at the Work Place
        • Heptathlon
        • School Scores
        • Children's Games
        • Valentine’s Day Spending
        • Women Live Longer?
        • Hearing Loss in Children
        • California Transit Payments
        • Seaweed Nutrients
        • Coffee Flavours
        • Legionnaire’s Disease in the USA
        • Antarctic Sea ice
        • William Farr's Observations on Cholera in London
    • R for Artists and Managers
      • 🕶 Lab-1: Science, Human Experience, Experiments, and Data
      • Lab-2: Down the R-abbit Hole…
      • Lab-3: Drink Me!
      • Lab-4: I say what I mean and I mean what I say
      • Lab-5: Twas brillig, and the slithy toves…
      • Lab-6: These Roses have been Painted !!
      • Lab-7: The Lobster Quadrille
      • Lab-8: Did you ever see such a thing as a drawing of a muchness?
      • Lab-9: If you please sir…which way to the Secret Garden?
      • Lab-10: An Invitation from the Queen…to play Croquet
      • Lab-11: The Queen of Hearts, She Made some Tarts
      • Lab-12: Time is a Him!!
      • Iteration: Learning to purrr
      • Lab-13: Old Tortoise Taught Us
      • Lab-14: You’re are Nothing but a Pack of Cards!!
    • ML for Artists and Managers
      • 🐉 Intro to Orange
      • ML - Regression
      • ML - Classification
      • ML - Clustering
      • 🕔 Modelling Time Series
    • TRIZ for Problem Solvers
      • I am Water
      • I am What I yam
      • Birds of Different Feathers
      • I Connect therefore I am
      • I Think, Therefore I am
      • The Art of Parallel Thinking
      • A Year of Metaphoric Thinking
      • TRIZ - Problems and Contradictions
      • TRIZ - The Unreasonable Effectiveness of Available Resources
      • TRIZ - The Ideal Final Result
      • TRIZ - A Contradictory Language
      • TRIZ - The Contradiction Matrix Workflow
      • TRIZ - The Laws of Evolution
      • TRIZ - Substance Field Analysis, and ARIZ
    • Math Models for Creative Coders
      • Maths Basics
        • Vectors
        • Matrix Algebra Whirlwind Tour
        • content/courses/MathModelsDesign/Modules/05-Maths/70-MultiDimensionGeometry/index.qmd
      • Tech
        • Tools and Installation
        • Adding Libraries to p5.js
        • Using Constructor Objects in p5.js
      • Geometry
        • Circles
        • Complex Numbers
        • Fractals
        • Affine Transformation Fractals
        • L-Systems
        • Kolams and Lusona
      • Media
        • Fourier Series
        • Additive Sound Synthesis
        • Making Noise Predictably
        • The Karplus-Strong Guitar Algorithm
      • AI
        • Working with Neural Nets
        • The Perceptron
        • The Multilayer Perceptron
        • MLPs and Backpropagation
        • Gradient Descent
      • Projects
        • Projects
    • Data Science with No Code
      • Data
      • Orange
      • Summaries
      • Counts
      • Quantity
      • 🕶 Happy Data are all Alike
      • Groups
      • Change
      • Rhythm
      • Proportions
      • Flow
      • Structure
      • Ranking
      • Space
      • Time
      • Networks
      • Surveys
      • Experiments
    • Tech for Creative Education
      • 🧭 Using Idyll
      • 🧭 Using Apparatus
      • 🧭 Using g9.js
    • Literary Jukebox: In Short, the World
      • Italy - Dino Buzzati
      • France - Guy de Maupassant
      • Japan - Hisaye Yamamoto
      • Peru - Ventura Garcia Calderon
      • Russia - Maxim Gorky
      • Egypt - Alifa Rifaat
      • Brazil - Clarice Lispector
      • England - V S Pritchett
      • Russia - Ivan Bunin
      • Czechia - Milan Kundera
      • Sweden - Lars Gustaffsson
      • Canada - John Cheever
      • Ireland - William Trevor
      • USA - Raymond Carver
      • Italy - Primo Levi
      • India - Ruth Prawer Jhabvala
      • USA - Carson McCullers
      • Zimbabwe - Petina Gappah
      • India - Bharati Mukherjee
      • USA - Lucia Berlin
      • USA - Grace Paley
      • England - Angela Carter
      • USA - Kurt Vonnegut
      • Spain-Merce Rodoreda
      • Israel - Ruth Calderon
      • Israel - Etgar Keret
  • Posts
  • Blogs and Talks

On this page

  • Setting up R Packages
  • Introduction
  • Read the Modified Data
  • Inspect the Data
  • Data Dictionary
  • Research Question
  • Join the Data
  • Plot the Data
  • Tasks and Discussion
  1. Teaching
  2. Data Analytics for Managers and Creators
  3. Case Studies
  4. Legionnaire’s Disease in the USA

Legionnaire’s Disease in the USA

Setting up R Packages

library(tidyverse)
library(mosaic)
library(skimr)
library(ggformula)
library(patchwork)

Plot Theme

Show the Code
# https://stackoverflow.com/questions/74491138/ggplot-custom-fonts-not-working-in-quarto

# Chunk options
knitr::opts_chunk$set(
  fig.width = 7,
  fig.asp = 0.618, # Golden Ratio
  # out.width = "80%",
  fig.align = "center"
)
### Ggplot Theme
### https://rpubs.com/mclaire19/ggplot2-custom-themes

theme_custom <- function() {
  font <- "Roboto Condensed" # assign font family up front

  theme_classic(base_size = 14) %+replace% # replace elements we want to change

    theme(
      panel.grid.minor = element_blank(), # strip minor gridlines
      text = element_text(family = font),
      # text elements
      plot.title = element_text( # title
        family = font, # set font family
        size = 20, # set font size
        face = "bold", # bold typeface
        hjust = 0, # left align
        # vjust = 2                #raise slightly
        margin = margin(0, 0, 10, 0)
      ),
      plot.subtitle = element_text( # subtitle
        family = font, # font family
        size = 14, # font size
        hjust = 0,
        margin = margin(2, 0, 5, 0)
      ),
      plot.caption = element_text( # caption
        family = font, # font family
        size = 8, # font size
        hjust = 1
      ), # right align

      axis.title = element_text( # axis titles
        family = font, # font family
        size = 10 # font size
      ),
      axis.text = element_text( # axis text
        family = font, # axis family
        size = 8
      ) # font size
    )
}

# Set graph theme
theme_set(new = theme_custom())
#

Introduction

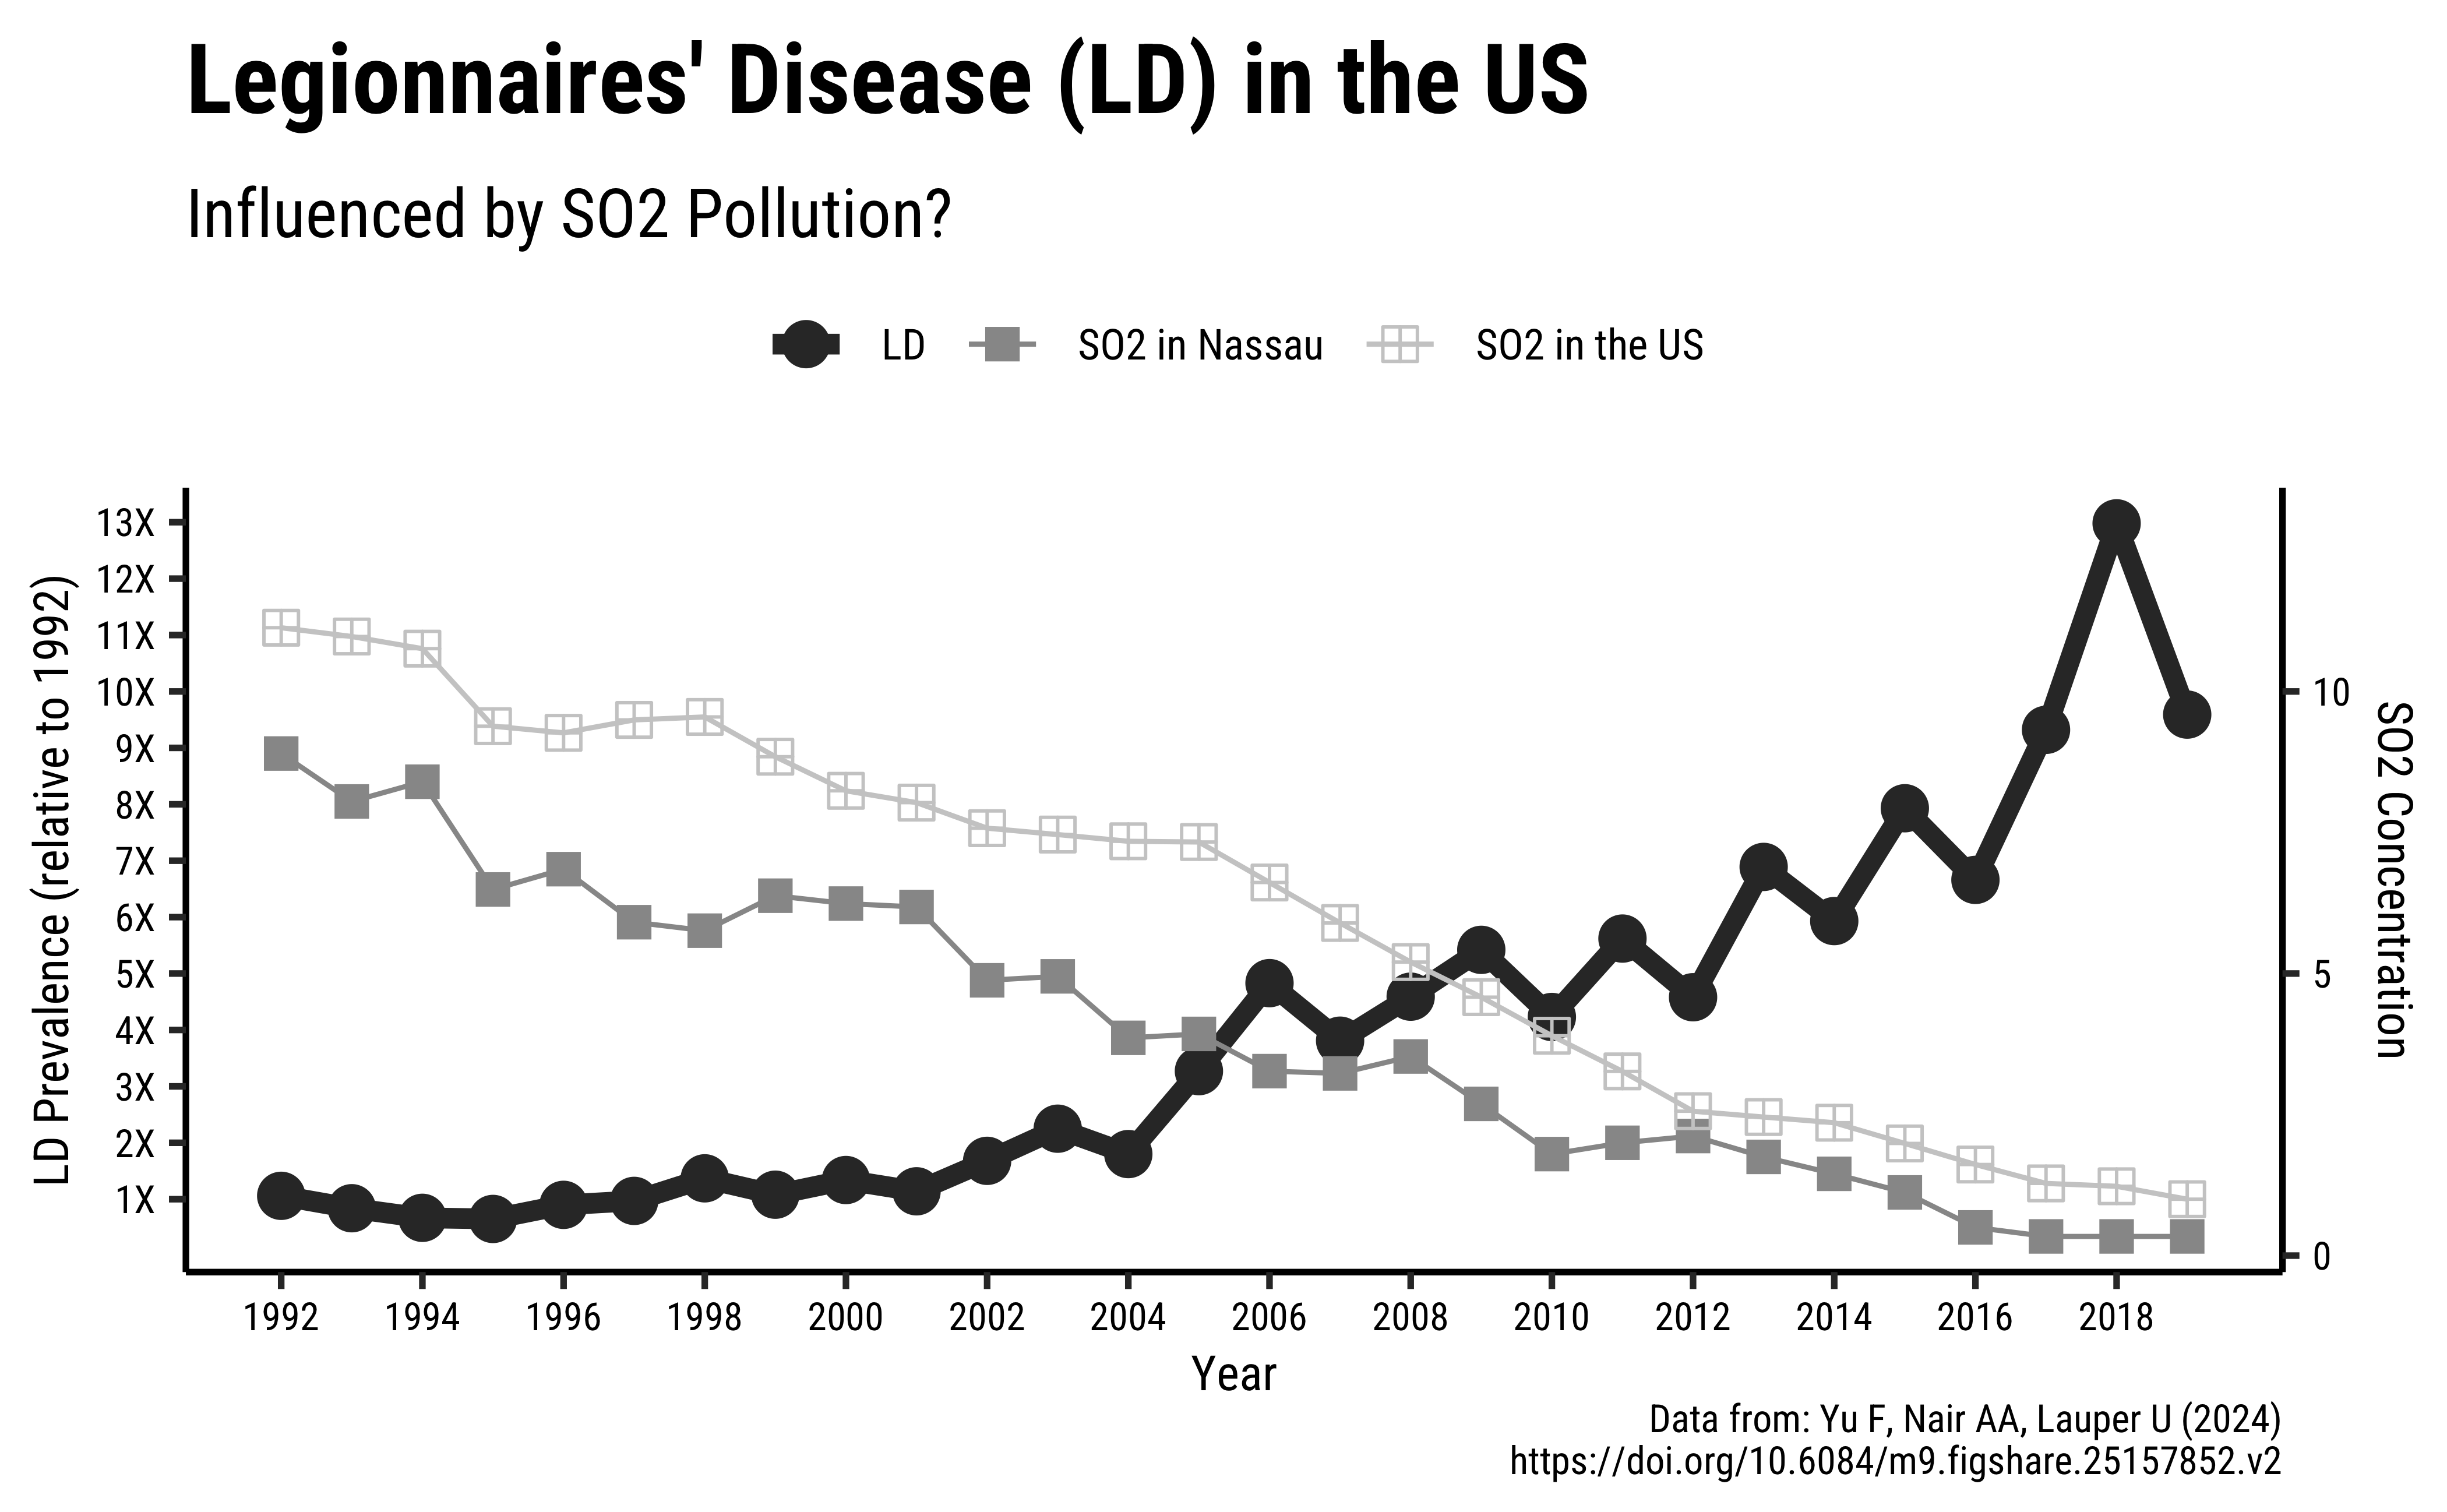
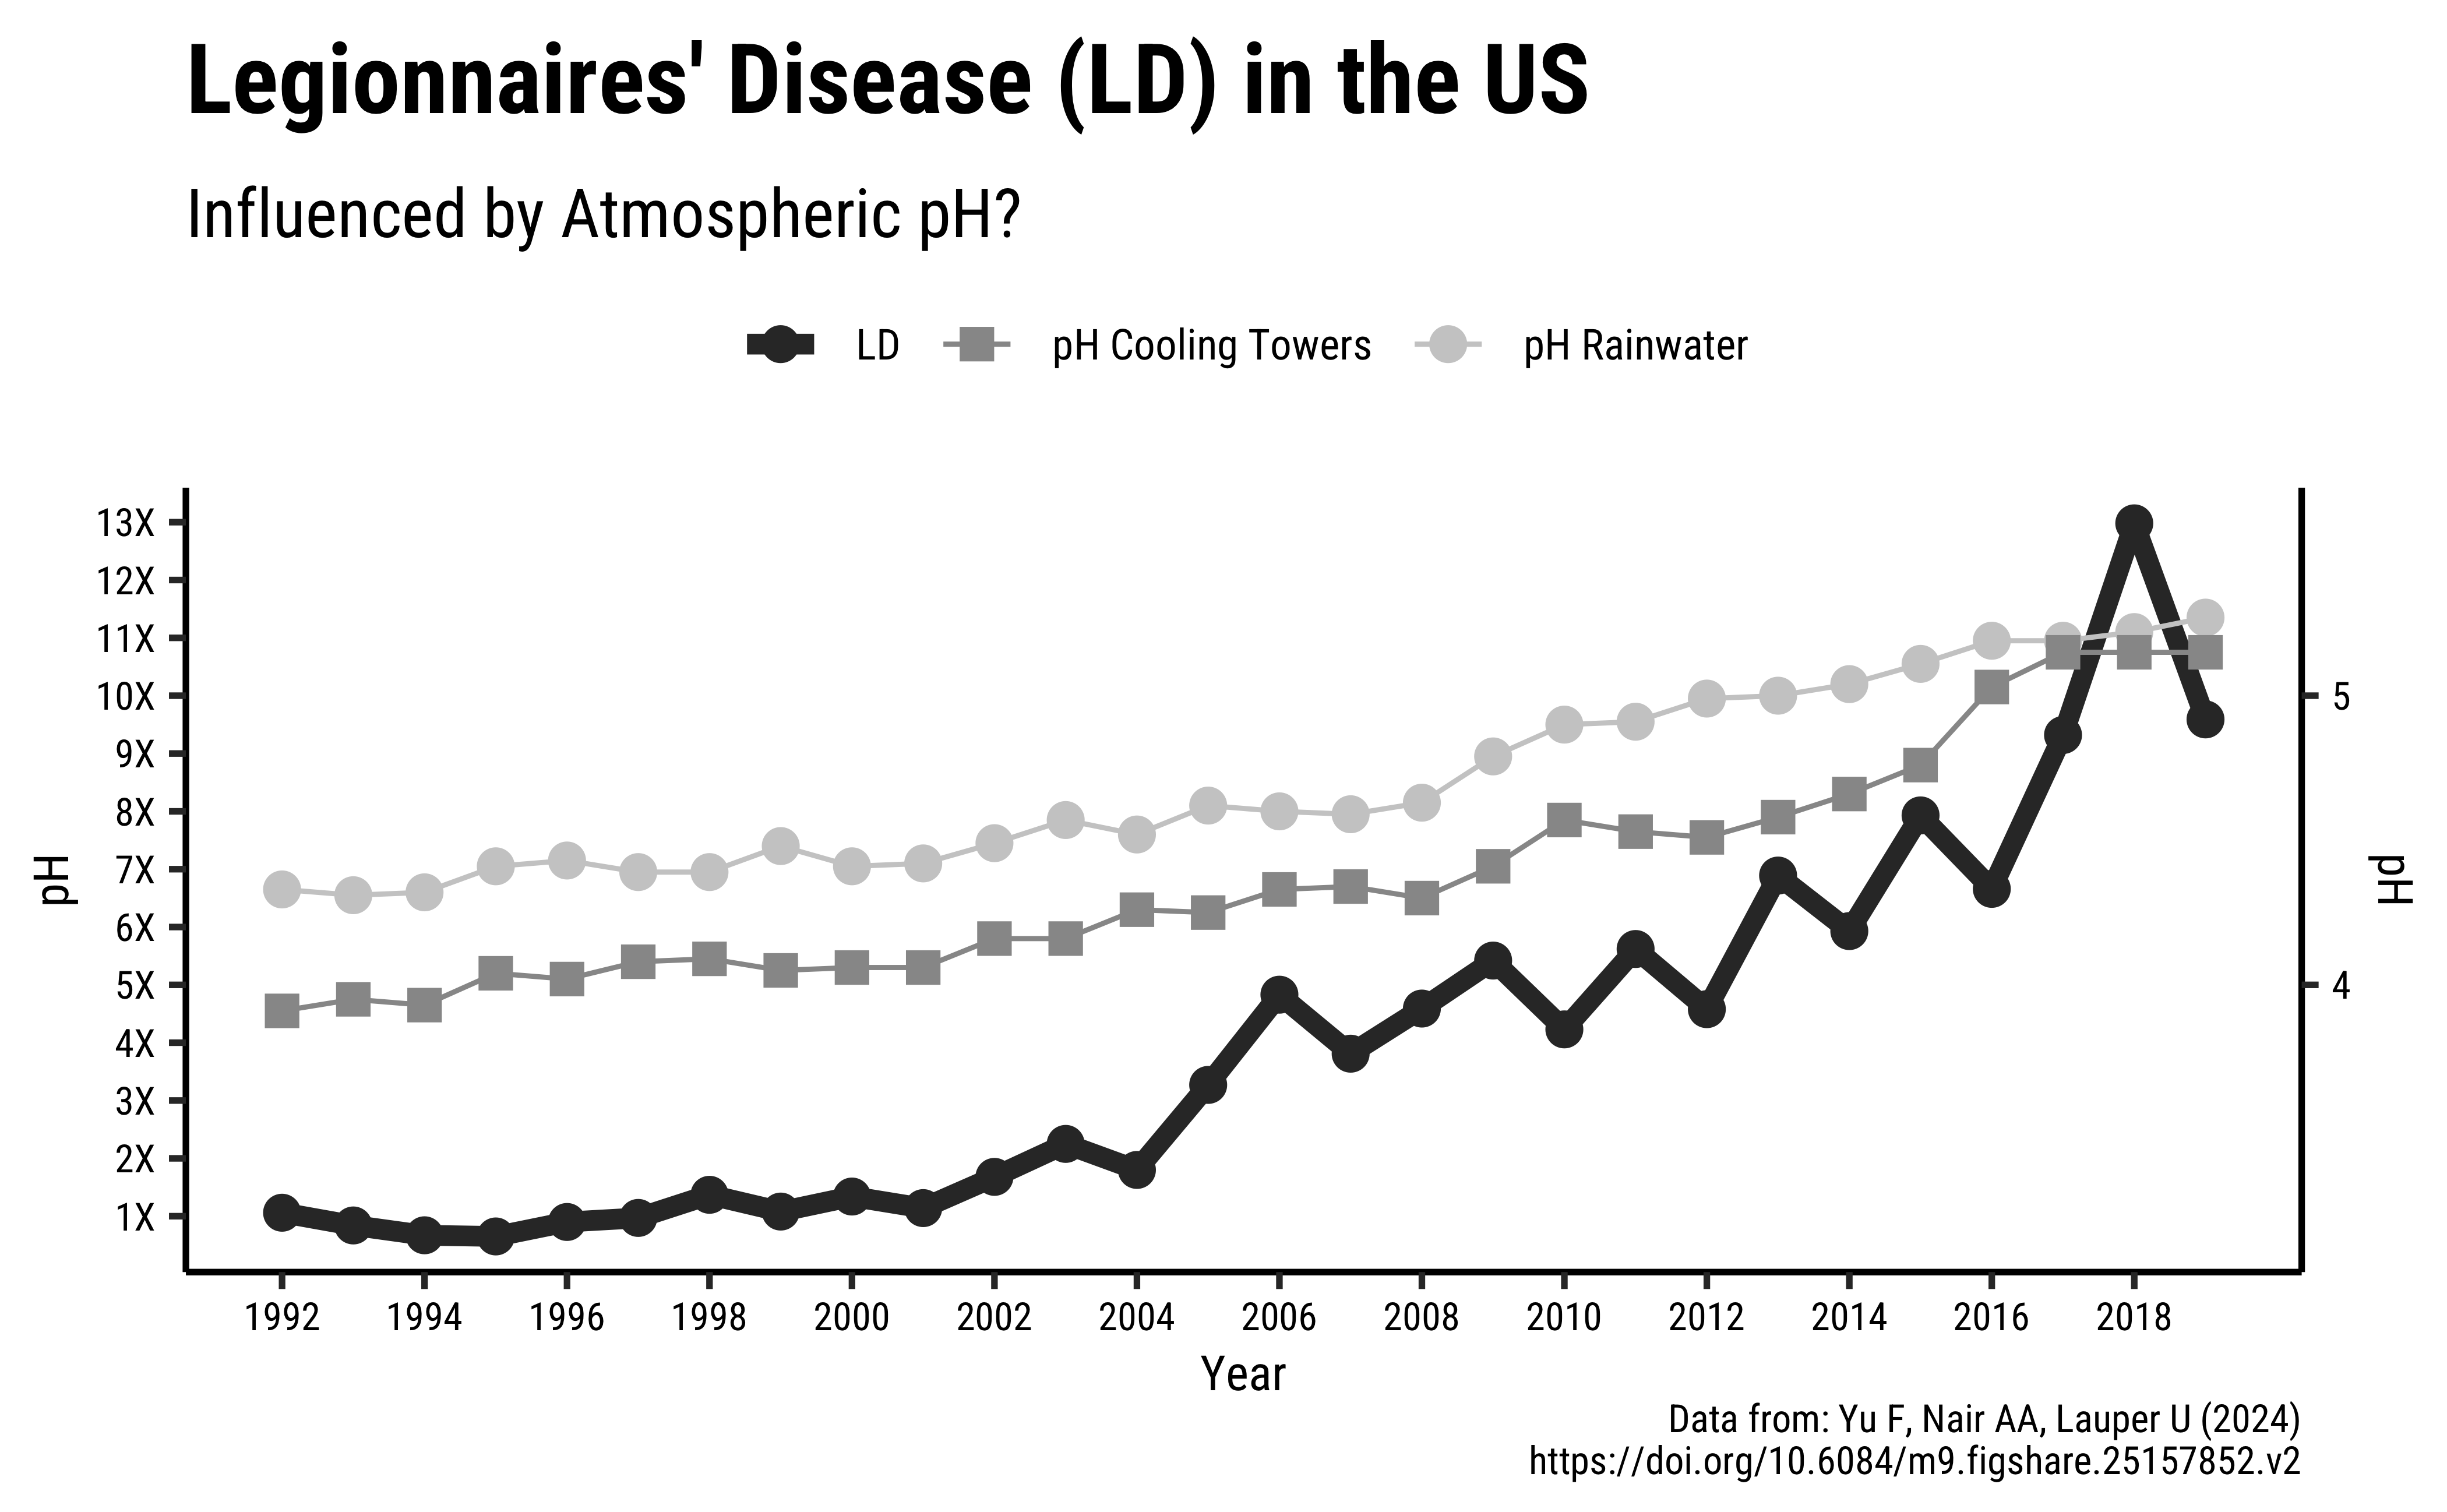
Legionnaires’ disease (LD) is a severe form of pneumonia (∼10–25% fatality rate) caused by inhalation of aerosols containing Legionella, a pathogenic gram-negative bacteria. These bacteria can grow, spread, and aerosolize through building water systems. A recent dramatic increase in LD incidence has been observed globally, with a 9-fold increase in the United States from 2000 to 2018,

Records were also maintained of atmospheric Sulphur Dioxide (SO2) and the acidity i.e. pH of the atmosphere around building water systems such as Cooling Towers (CT) and in Rainwater.

This data is from this paper: Yu F, Nair AA, Lauper U (2024), https://doi.org/10.6084/m9.figshare.25157852.v2

Read the Modified Data


Inspect the Data

```{r}
#| label: inspect-skim-glimpse

# Write in
```

Data Dictionary

NoteQuantitative Variables

Write in.

NoteQualitative Variables

Write in.

NoteObservations

Write in.

Describe how you may plan to transform the data.

Research Question

Note

Write in! Look first at the Charts below!

Join the Data

```{r}
#| label: data-preprocessing
#
# Write in your code here
# to prepare this data as shown below
# to generate the plot that follows
```

Here is the plot-ready data:

ABCDEFGHIJ0123456789
year
<int>
ld
<dbl>
so2_Nassau_Erie
<dbl>
so2_US
<dbl>
pH_rainwater
<dbl>
upper
<dbl>
lower
<dbl>
pH_CT
<dbl>
19921.068.9011.1298674.330.180.083.91
19930.848.0510.9741244.310.100.073.95
19940.678.4010.7589054.320.150.093.93
19950.656.499.3844314.410.140.094.04
19960.906.859.2666244.430.210.154.02
19970.975.919.4957524.390.110.074.08
19981.375.769.5484444.390.090.084.09
19991.086.388.8433534.480.150.134.05
20001.346.248.2392864.410.160.144.06
20011.146.188.0299434.420.180.094.06
Next
123
Previous
1-10 of 28 rows

Plot the Data

Two plots were generated by the researchers with this data. Can you reproduce these? Do these graphs prove/disprove any of your hypotheses? What might have been the Hypotheses that led the creating of these graphs?

Tasks and Discussion

  • Complete the Data Dictionary.
  • Select and Transform the variables as shown. Combine the multiple datasets into one if needed!
  • Create the graphs shown and discuss the following questions:
    • Identify the type of charts
    • Identify the variables used for various geometrical aspects (x, y, fill…). Name the variables appropriately.
    • What is a peculiar feature of these graphs?
  • What might have been the Hypothesis/Research Question to which the response was Chart?
  • What data gathering / research activity might have been carried out to obtain the data graphed here? Provide some details.
  • Write a short story based on the chart, describing your inference/surprise.
  • Is there a paradox in this case study? Hint: SO2 is caused by cars/busses running on fossil fuels.
  • What Statistical Tests might you run to confirm what the charts are saying?
Back to top
Coffee Flavours
Antarctic Sea ice

License: CC BY-SA 2.0

Website made with ❤️ and Quarto, by Arvind V.

Hosted by Netlify .