Setting up R Packages
Plot Theme and Fonts
Show the Code
```{r}
#| code-fold: true
#| message: false
#| warning: false

knitr::opts_chunk$set(
  fig.width = 7,
  fig.asp = 0.618, # Golden Ratio
  # out.width = "80%",
  fig.align = "center"
)
##
## https://stackoverflow.com/questions/36476751/associate-a-color-palette-with-ggplot2-theme
##
my_colours <- c("#fd7f6f", "#7eb0d5", "#b2e061", "#bd7ebe", "#ffb55a", "#ffee65", "#beb9db", "#fdcce5", "#8bd3c7")
my_pastels <- c("#66C5CC", "#F6CF71", "#F89C74", "#DCB0F2", "#87C55F", "#9EB9F3", "#FE88B1", "#C9DB74", "#8BE0A4", "#B497E7", "#D3B484", "#B3B3B3")
my_greys <- c("#000000", "#333333", "#666666", "#999999", "#cccccc")
my_vivids <- c("#E58606", "#5D69B1", "#52BCA3", "#99C945", "#CC61B0", "#24796C", "#DAA51B", "#2F8AC4", "#764E9F", "#ED645A", "#CC3A8E", "#A5AA99")

my_bolds <- c("#7F3C8D", "#11A579", "#3969AC", "#F2B701", "#E73F74", "#80BA5A", "#E68310", "#008695", "#CF1C90", "#f97b72", "#4b4b8f", "#A5AA99")

library(systemfonts)
library(showtext)
## Clean the slate
systemfonts::clear_local_fonts()
systemfonts::clear_registry()
##
showtext_opts(dpi = 96) # set DPI for showtext
sysfonts::font_add(
  family = "Alegreya",
  regular = "../../../../../../fonts/Alegreya-Regular.ttf",
  bold = "../../../../../../fonts/Alegreya-Bold.ttf",
  italic = "../../../../../../fonts/Alegreya-Italic.ttf",
  bolditalic = "../../../../../../fonts/Alegreya-BoldItalic.ttf"
)

sysfonts::font_add(
  family = "Roboto Condensed",
  regular = "../../../../../../fonts/RobotoCondensed-Regular.ttf",
  bold = "../../../../../../fonts/RobotoCondensed-Bold.ttf",
  italic = "../../../../../../fonts/RobotoCondensed-Italic.ttf",
  bolditalic = "../../../../../../fonts/RobotoCondensed-BoldItalic.ttf"
)
showtext_auto(enable = TRUE) # enable showtext
##
theme_custom <- function() {
  font <- "Alegreya" # assign font family up front

  theme_classic(base_size = 14, base_family = font) %+replace% # replace elements we want to change

    theme(
      text = element_text(family = font), # set base font family

      # text elements
      plot.title = element_text( # title
        family = font, # set font family
        size = 24, # set font size
        face = "bold", # bold typeface
        hjust = 0, # left align
        margin = margin(t = 5, r = 0, b = 5, l = 0)
      ), # margin
      plot.title.position = "plot",
      plot.subtitle = element_text( # subtitle
        family = font, # font family
        size = 14, # font size
        hjust = 0, # left align
        margin = margin(t = 5, r = 0, b = 10, l = 0)
      ), # margin

      plot.caption = element_text( # caption
        family = font, # font family
        size = 9, # font size
        hjust = 1
      ), # right align

      plot.caption.position = "plot", # right align

      plot.background = element_rect(fill = "navajowhite"),
      axis.title = element_text( # axis titles
        family = "Roboto Condensed", # font family
        size = 12
      ), # font size

      axis.text = element_text( # axis text
        family = "Roboto Condensed", # font family
        size = 9
      ), # font size

      axis.text.x = element_text( # margin for axis text
        margin = margin(5, b = 10)
      )

      # since the legend often requires manual tweaking
      # based on plot content, don't define it here
    )
}

## Use available fonts in ggplot text geoms too!
update_geom_defaults(geom = "text", new = list(
  family = "Roboto Condensed",
  face = "plain",
  size = 3.5,
  color = "#2b2b2b"
))

## Set the theme
theme_set(new = theme_custom())
```
Introduction
This is a dataset pertaining to furniture prices at IKEA, modified for ease of analysis and plotting.
Data
item_id <dbl> | name <chr> | category <fct> | price <dbl> | old_price <chr> | sellable_online <lgl> | |
|---|---|---|---|---|---|---|
| 29123958 | MINNEN | Beds (208) | 395.0 | SR 445 | TRUE | |
| 49278341 | BRIMNES | Beds (208) | 895.0 | SR 925 | TRUE | |
| 50461230 | SMÅGÖRA | Beds (208) | 595.0 | No old price | TRUE | |
| 89326463 | PLATSA | Beds (208) | 2111.0 | SR 2,205 | TRUE | |
| 50468953 | VATTVIKEN | Beds (208) | 995.0 | No old price | TRUE | |
| 69326609 | SLÄKT | Beds (208) | 540.0 | No old price | FALSE | |
| 59099136 | BRIMNES | Beds (208) | 795.0 | No old price | TRUE | |
| 40395245 | NEIDEN | Beds (208) | 99.0 | No old price | TRUE | |
| 69277307 | LEIRVIK | Beds (208) | 1195.0 | No old price | TRUE | |
| 70395239 | NEIDEN | Beds (208) | 199.0 | No old price | TRUE |
Download the Modified data
Data Dictionary
Quantitative Variables
Write in.
Qualitative Variables
Write in.
Observations
Write in.
Plot the Data
Task and Discussion
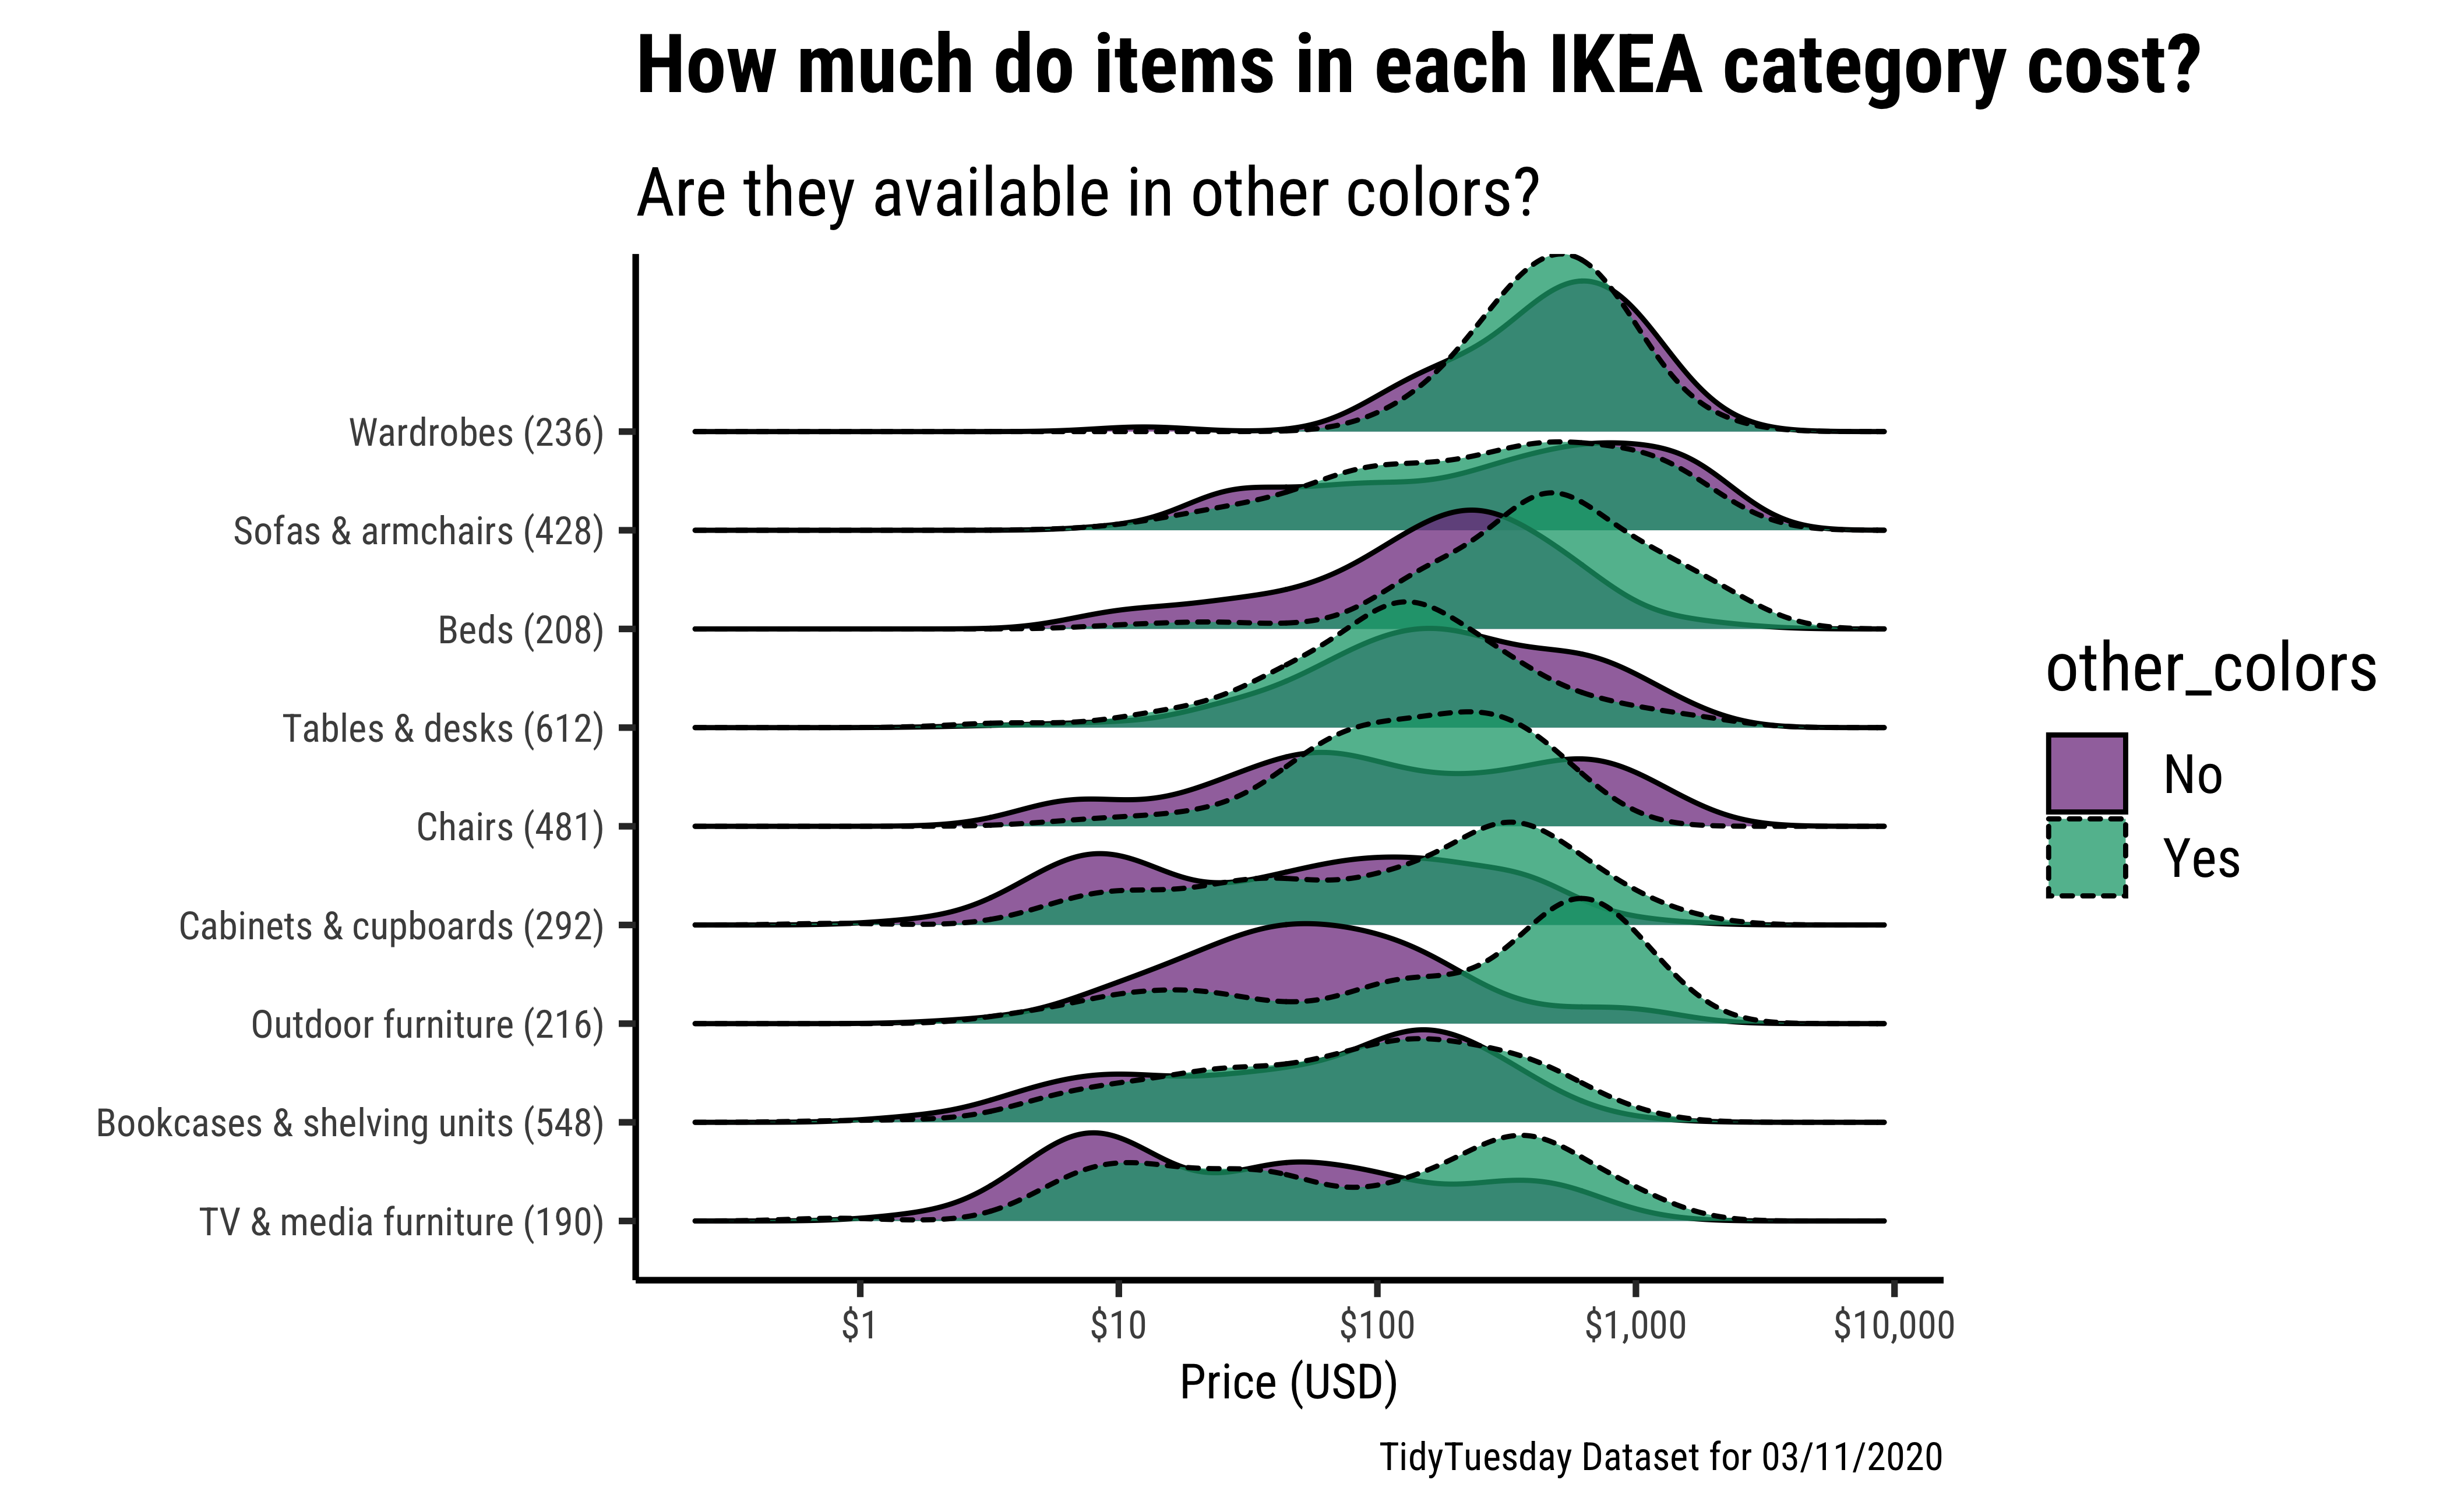
Complete the Data Dictionary. Create the graph shown and discuss the following questions:
- What is the kind of plot used in the chart?
- What variables have been used in the chart?
- What can you say about the scale on X-axis?
- What can you say about prices of items that are available in single colour versus those that are available in more than one colour?
- What is a good hypothesis to interpret the double-humped nature of some of the curves?