Setting up R Packages
Plot Theme
Show the Code
# https://stackoverflow.com/questions/74491138/ggplot-custom-fonts-not-working-in-quarto

# Chunk options
knitr::opts_chunk$set(
  fig.width = 7,
  fig.asp = 0.618, # Golden Ratio
  # out.width = "80%",
  fig.align = "center"
)
### Ggplot Theme
### https://rpubs.com/mclaire19/ggplot2-custom-themes

theme_custom <- function() {
  font <- "Roboto Condensed" # assign font family up front

  theme_classic(base_size = 14) %+replace% # replace elements we want to change

    theme(
      panel.grid.minor = element_blank(), # strip minor gridlines
      text = element_text(family = font),
      # text elements
      plot.title = element_text( # title
        family = font, # set font family
        size = 20, # set font size
        face = "bold", # bold typeface
        hjust = 0, # left align
        # vjust = 2                #raise slightly
        margin = margin(0, 0, 10, 0)
      ),
      plot.subtitle = element_text( # subtitle
        family = font, # font family
        size = 14, # font size
        hjust = 0,
        margin = margin(2, 0, 5, 0)
      ),
      plot.caption = element_text( # caption
        family = font, # font family
        size = 8, # font size
        hjust = 1
      ), # right align

      axis.title = element_text( # axis titles
        family = font, # font family
        size = 10 # font size
      ),
      axis.text = element_text( # axis text
        family = font, # axis family
        size = 8
      ) # font size
    )
}

# Set graph theme
theme_set(new = theme_custom())
#
Introduction
This dataset pertains to scores obtained by students in diverse subjects. Family Income is also part of this dataset.
Read the Data
Inspect and Clean the Data
Hint: Use the janitor package here to clean up the variable names. Try to use the big_camel case name format for variables.
Rows: 577
Columns: 99
$ Year                                              <dbl> 2005, 2005, 2005, 20…
$ StateCode                                         <chr> "AL", "AK", "AZ", "A…
$ StateName                                         <chr> "Alabama", "Alaska",…
$ TotalMath                                         <dbl> 559, 519, 530, 552, …
$ TotalTestTakers                                   <dbl> 3985, 3996, 18184, 1…
$ TotalVerbal                                       <dbl> 567, 523, 526, 563, …
$ AcademicSubjectsArtsMusicAverageGpa               <dbl> 3.92, 3.76, 3.85, 3.…
$ AcademicSubjectsArtsMusicAverageYears             <dbl> 2.2, 1.9, 2.1, 2.2, …
$ AcademicSubjectsEnglishAverageGpa                 <dbl> 3.53, 3.35, 3.45, 3.…
$ AcademicSubjectsEnglishAverageYears               <dbl> 3.9, 3.9, 3.9, 4.0, …
$ AcademicSubjectsForeignLanguagesAverageGpa        <dbl> 3.54, 3.34, 3.41, 3.…
$ AcademicSubjectsForeignLanguagesAverageYears      <dbl> 2.6, 2.1, 2.6, 2.6, …
$ AcademicSubjectsMathematicsAverageGpa             <dbl> 3.41, 3.06, 3.25, 3.…
$ AcademicSubjectsMathematicsAverageYears           <dbl> 4.0, 3.5, 3.9, 4.1, …
$ AcademicSubjectsNaturalSciencesAverageGpa         <dbl> 3.52, 3.25, 3.43, 3.…
$ AcademicSubjectsNaturalSciencesAverageYears       <dbl> 3.9, 3.2, 3.4, 3.7, …
$ AcademicSubjectsSocialSciencesHistoryAverageGpa   <dbl> 3.59, 3.39, 3.55, 3.…
$ AcademicSubjectsSocialSciencesHistoryAverageYears <dbl> 3.9, 3.4, 3.3, 3.6, …
$ FamilyIncomeBetween20_40KMath                     <dbl> 513, 492, 498, 513, …
$ FamilyIncomeBetween20_40KTestTakers               <dbl> 324, 401, 2121, 180,…
$ FamilyIncomeBetween20_40KVerbal                   <dbl> 527, 500, 495, 526, …
$ FamilyIncomeBetween40_60KMath                     <dbl> 539, 517, 520, 543, …
$ FamilyIncomeBetween40_60KTestTakers               <dbl> 442, 539, 2270, 245,…
$ FamilyIncomeBetween40_60KVerbal                   <dbl> 551, 522, 518, 555, …
$ FamilyIncomeBetween60_80KMath                     <dbl> 550, 513, 524, 553, …
$ FamilyIncomeBetween60_80KTestTakers               <dbl> 473, 603, 2372, 227,…
$ FamilyIncomeBetween60_80KVerbal                   <dbl> 564, 519, 523, 570, …
$ FamilyIncomeBetween80_100KMath                    <dbl> 566, 528, 534, 570, …
$ FamilyIncomeBetween80_100KTestTakers              <dbl> 475, 444, 1866, 147,…
$ FamilyIncomeBetween80_100KVerbal                  <dbl> 577, 534, 533, 580, …
$ FamilyIncomeLessThan20KMath                       <dbl> 462, 464, 485, 489, …
$ FamilyIncomeLessThan20KTestTakers                 <dbl> 175, 191, 891, 107, …
$ FamilyIncomeLessThan20KVerbal                     <dbl> 474, 467, 474, 486, …
$ FamilyIncomeMoreThan100KMath                      <dbl> 588, 541, 554, 572, …
$ FamilyIncomeMoreThan100KTestTakers                <dbl> 980, 540, 3083, 314,…
$ FamilyIncomeMoreThan100KVerbal                    <dbl> 590, 544, 546, 589, …
$ GpaAMinusMath                                     <dbl> 569, 544, 541, 559, …
$ GpaAMinusTestTakers                               <dbl> 724, 673, 3334, 298,…
$ GpaAMinusVerbal                                   <dbl> 575, 546, 535, 572, …
$ GpaAPlusMath                                      <dbl> 622, 600, 605, 629, …
$ GpaAPlusTestTakers                                <dbl> 563, 173, 1684, 273,…
$ GpaAPlusVerbal                                    <dbl> 623, 604, 593, 639, …
$ GpaAMath                                          <dbl> 600, 580, 571, 579, …
$ GpaATestTakers                                    <dbl> 1032, 671, 3854, 457…
$ GpaAVerbal                                        <dbl> 608, 578, 563, 583, …
$ GpaBMath                                          <dbl> 514, 492, 498, 492, …
$ GpaBTestTakers                                    <dbl> 1253, 1622, 7193, 43…
$ GpaBVerbal                                        <dbl> 525, 499, 499, 511, …
$ GpaCMath                                          <dbl> 436, 466, 458, 419, …
$ GpaCTestTakers                                    <dbl> 188, 418, 1184, 57, …
$ GpaCVerbal                                        <dbl> 451, 472, 464, 436, …
$ GpaDOrLowerMath                                   <dbl> 0, 424, 439, 0, 419,…
$ GpaDOrLowerTestTakers                             <dbl> 0, 12, 16, 0, 240, 1…
$ GpaDOrLowerVerbal                                 <dbl> 0, 466, 435, 0, 408,…
$ GpaNoResponseMath                                 <dbl> 0, 0, 0, 0, 0, 0, 0,…
$ GpaNoResponseTestTakers                           <dbl> 225, 427, 919, 78, 1…
$ GpaNoResponseVerbal                               <dbl> 0, 0, 0, 0, 0, 0, 0,…
$ GenderFemaleMath                                  <dbl> 538, 505, 513, 536, …
$ GenderFemaleTestTakers                            <dbl> 2072, 2161, 9806, 85…
$ GenderFemaleVerbal                                <dbl> 561, 521, 522, 558, …
$ GenderMaleMath                                    <dbl> 582, 535, 549, 570, …
$ GenderMaleTestTakers                              <dbl> 1913, 1835, 8378, 74…
$ GenderMaleVerbal                                  <dbl> 574, 526, 531, 570, …
$ ScoreRangesBetween200To300MathFemales             <dbl> 22, 30, 119, 12, 297…
$ ScoreRangesBetween200To300MathMales               <dbl> 10, 20, 72, 7, 1453,…
$ ScoreRangesBetween200To300MathTotal               <dbl> 32, 50, 191, 19, 443…
$ ScoreRangesBetween200To300VerbalFemales           <dbl> 14, 26, 115, 9, 3382…
$ ScoreRangesBetween200To300VerbalMales             <dbl> 17, 26, 86, 3, 2433,…
$ ScoreRangesBetween200To300VerbalTotal             <dbl> 31, 52, 201, 12, 581…
$ ScoreRangesBetween300To400MathFemales             <dbl> 173, 233, 881, 68, 1…
$ ScoreRangesBetween300To400MathMales               <dbl> 93, 153, 450, 31, 71…
$ ScoreRangesBetween300To400MathTotal               <dbl> 266, 386, 1331, 99, …
$ ScoreRangesBetween300To400VerbalFemales           <dbl> 123, 218, 739, 46, 1…
$ ScoreRangesBetween300To400VerbalMales             <dbl> 84, 171, 613, 42, 10…
$ ScoreRangesBetween300To400VerbalTotal             <dbl> 207, 389, 1352, 88, …
$ ScoreRangesBetween400To500MathFemales             <dbl> 514, 696, 3215, 210,…
$ ScoreRangesBetween400To500MathMales               <dbl> 293, 485, 1948, 137,…
$ ScoreRangesBetween400To500MathTotal               <dbl> 807, 1181, 5163, 347…
$ ScoreRangesBetween400To500VerbalFemales           <dbl> 430, 656, 3048, 183,…
$ ScoreRangesBetween400To500VerbalMales             <dbl> 332, 552, 2398, 141,…
$ ScoreRangesBetween400To500VerbalTotal             <dbl> 762, 1208, 5446, 324…
$ ScoreRangesBetween500To600MathFemales             <dbl> 722, 813, 3576, 316,…
$ ScoreRangesBetween500To600MathMales               <dbl> 614, 616, 3152, 244,…
$ ScoreRangesBetween500To600MathTotal               <dbl> 1336, 1429, 6728, 56…
$ ScoreRangesBetween500To600VerbalFemales           <dbl> 690, 729, 3661, 302,…
$ ScoreRangesBetween500To600VerbalMales             <dbl> 617, 596, 3101, 236,…
$ ScoreRangesBetween500To600VerbalTotal             <dbl> 1307, 1325, 6762, 53…
$ ScoreRangesBetween600To700MathFemales             <dbl> 485, 342, 1688, 204,…
$ ScoreRangesBetween600To700MathMales               <dbl> 611, 445, 2126, 239,…
$ ScoreRangesBetween600To700MathTotal               <dbl> 1096, 787, 3814, 443…
$ ScoreRangesBetween600To700VerbalFemales           <dbl> 596, 423, 1831, 242,…
$ ScoreRangesBetween600To700VerbalMales             <dbl> 613, 375, 1679, 226,…
$ ScoreRangesBetween600To700VerbalTotal             <dbl> 1209, 798, 3510, 468…
$ ScoreRangesBetween700To800MathFemales             <dbl> 156, 47, 327, 49, 54…
$ ScoreRangesBetween700To800MathMales               <dbl> 292, 116, 630, 83, 8…
$ ScoreRangesBetween700To800MathTotal               <dbl> 448, 163, 957, 132, …
$ ScoreRangesBetween700To800VerbalFemales           <dbl> 219, 109, 412, 77, 5…
$ ScoreRangesBetween700To800VerbalMales             <dbl> 250, 115, 501, 93, 4…
$ ScoreRangesBetween700To800VerbalTotal             <dbl> 469, 224, 913, 170, …
Data Dictionary
Quantitative Variables
Write in.
Qualitative Variables
Write in.
Observations
Write in.
Analyse the Data
```{r}
#| label: data-preprocessing
#
# Write in your code here
# to prepare this data as shown below
# to generate the plot that follows
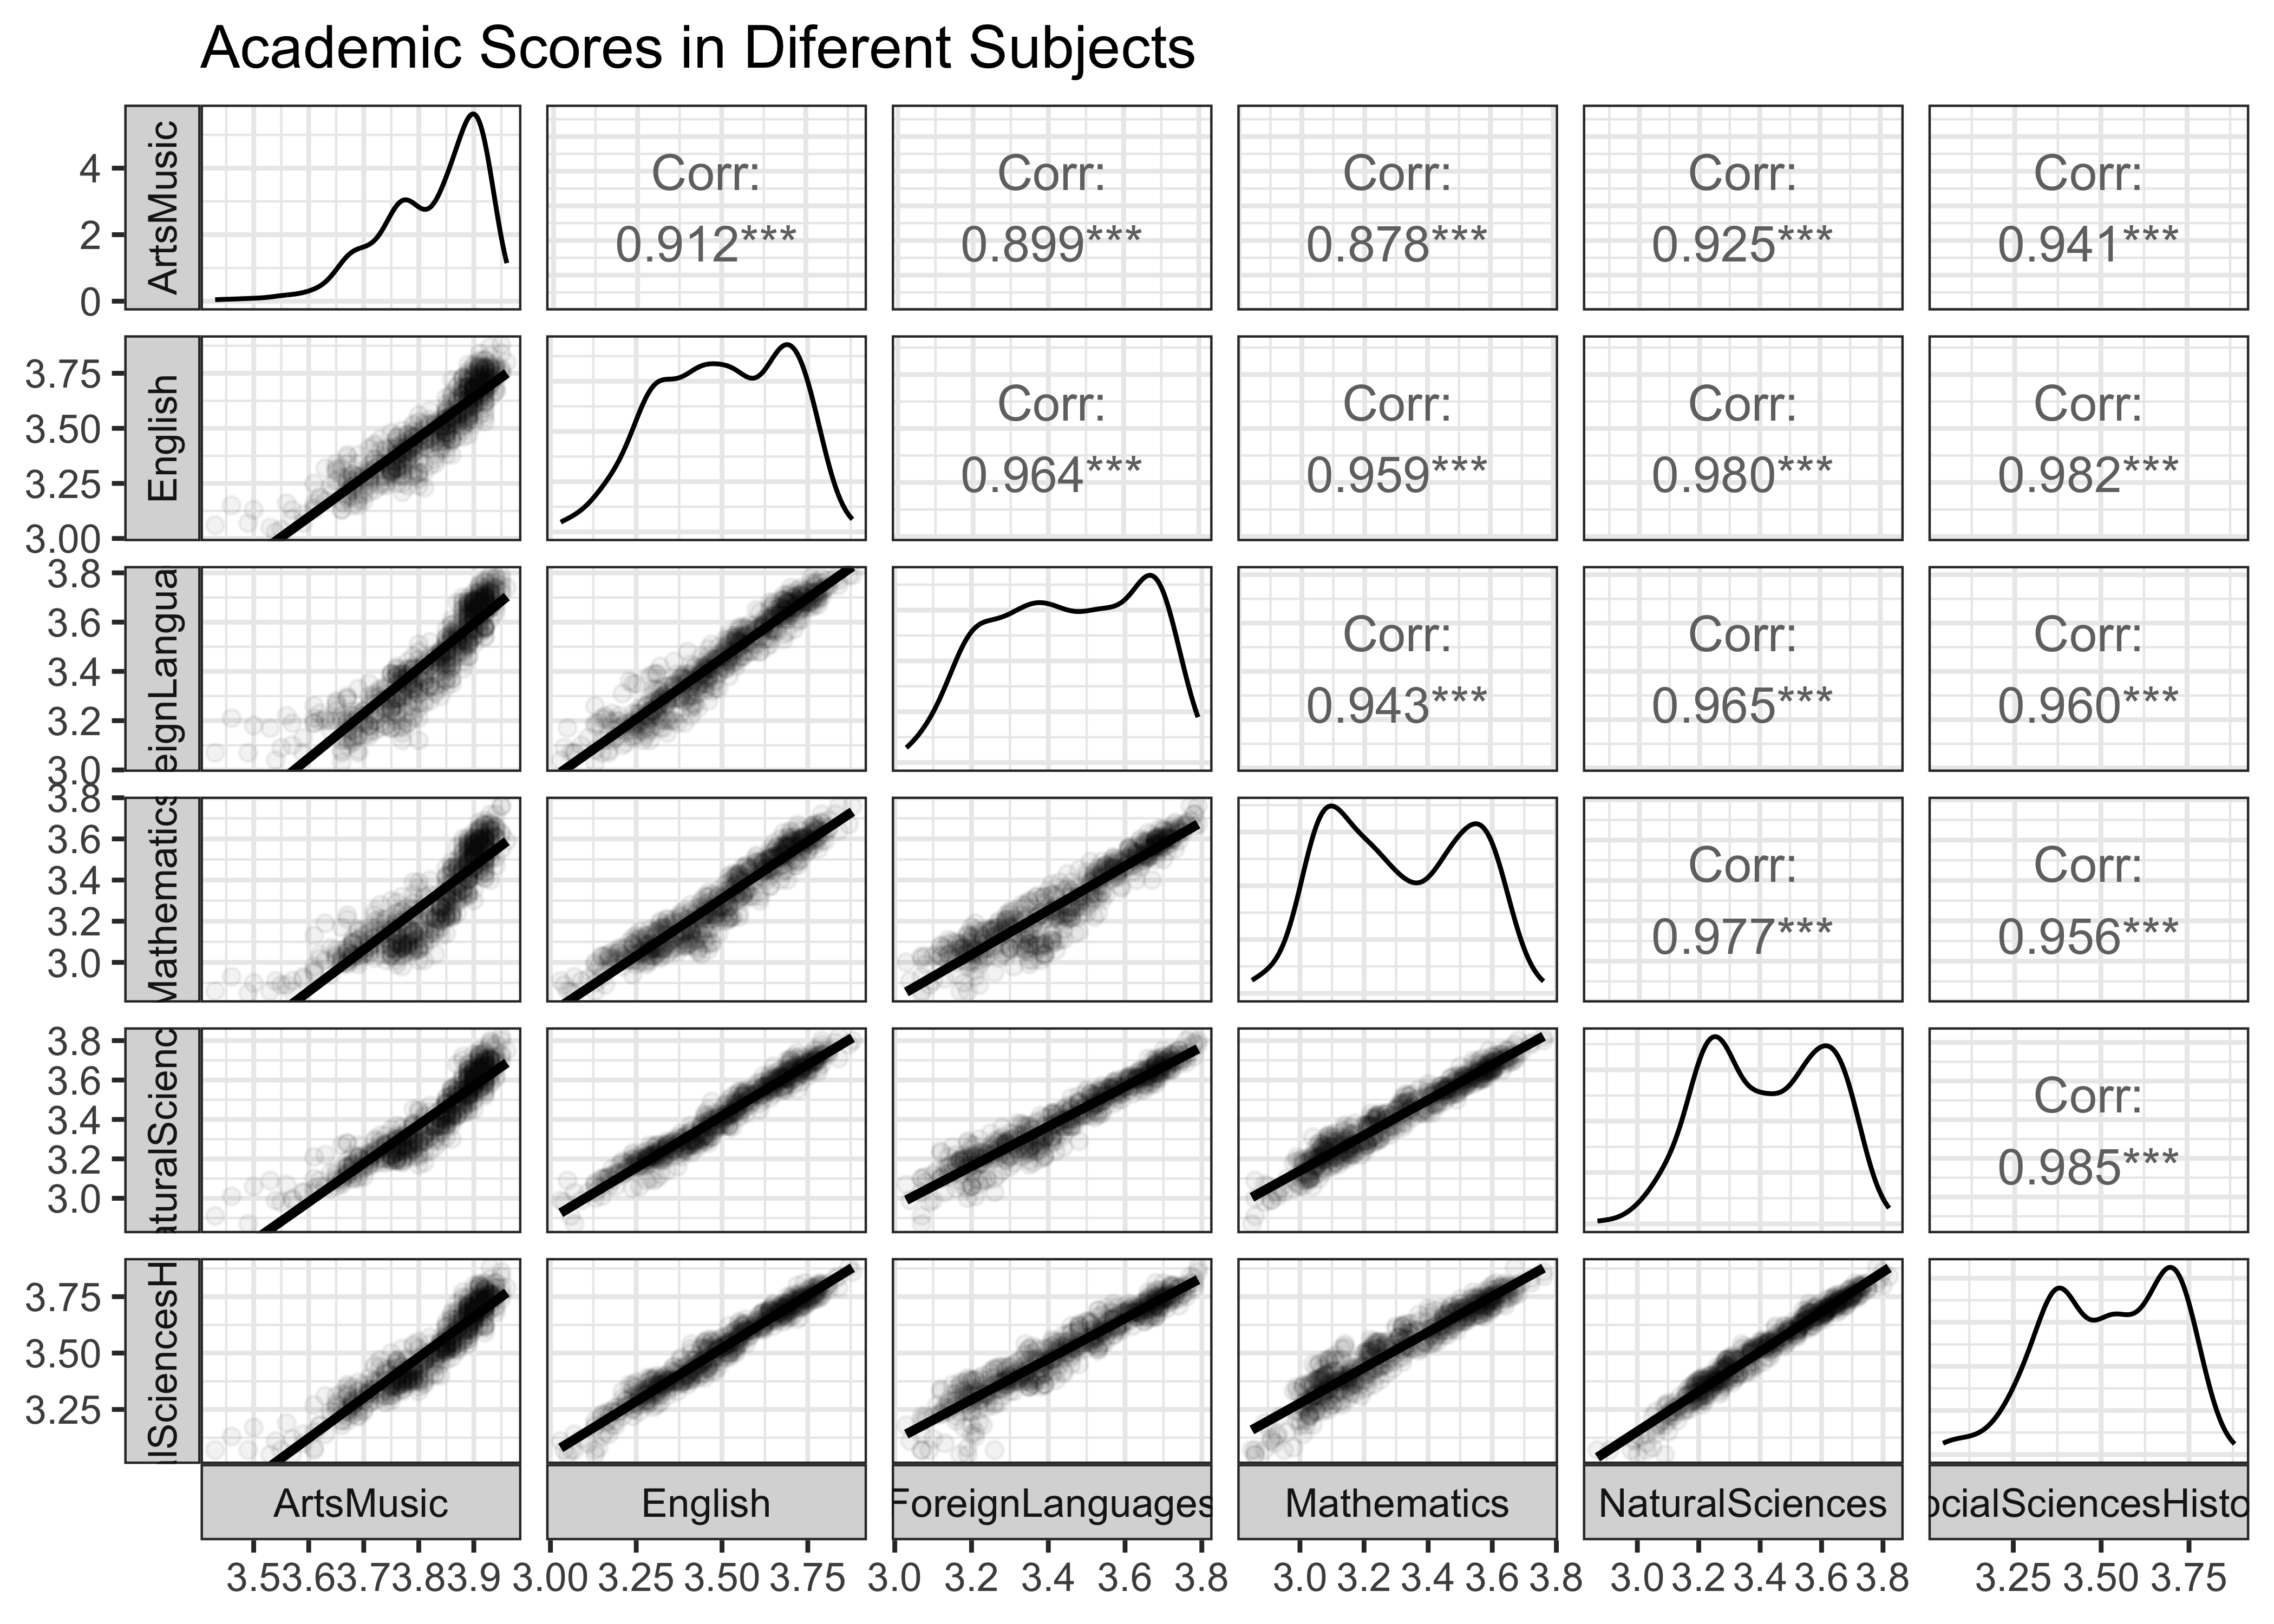
```Plot the Data: All Subjects
ArtsMusic <dbl> | English <dbl> | ForeignLanguages <dbl> | Mathematics <dbl> | NaturalSciences <dbl> | SocialSciencesHistory <dbl> |
|---|---|---|---|---|---|
| 3.92 | 3.53 | 3.54 | 3.41 | 3.52 | 3.59 |
| 3.76 | 3.35 | 3.34 | 3.06 | 3.25 | 3.39 |
| 3.85 | 3.45 | 3.41 | 3.25 | 3.43 | 3.55 |
| 3.90 | 3.61 | 3.64 | 3.46 | 3.55 | 3.67 |
| 3.76 | 3.32 | 3.29 | 3.05 | 3.20 | 3.38 |
| 3.88 | 3.49 | 3.41 | 3.33 | 3.43 | 3.56 |
| 3.66 | 3.13 | 3.03 | 3.00 | 3.07 | 3.18 |
| 3.71 | 3.21 | 3.18 | 3.07 | 3.19 | 3.30 |
| 3.54 | 3.03 | 3.04 | 2.91 | 2.99 | 3.11 |
| 3.77 | 3.29 | 3.30 | 3.07 | 3.27 | 3.39 |
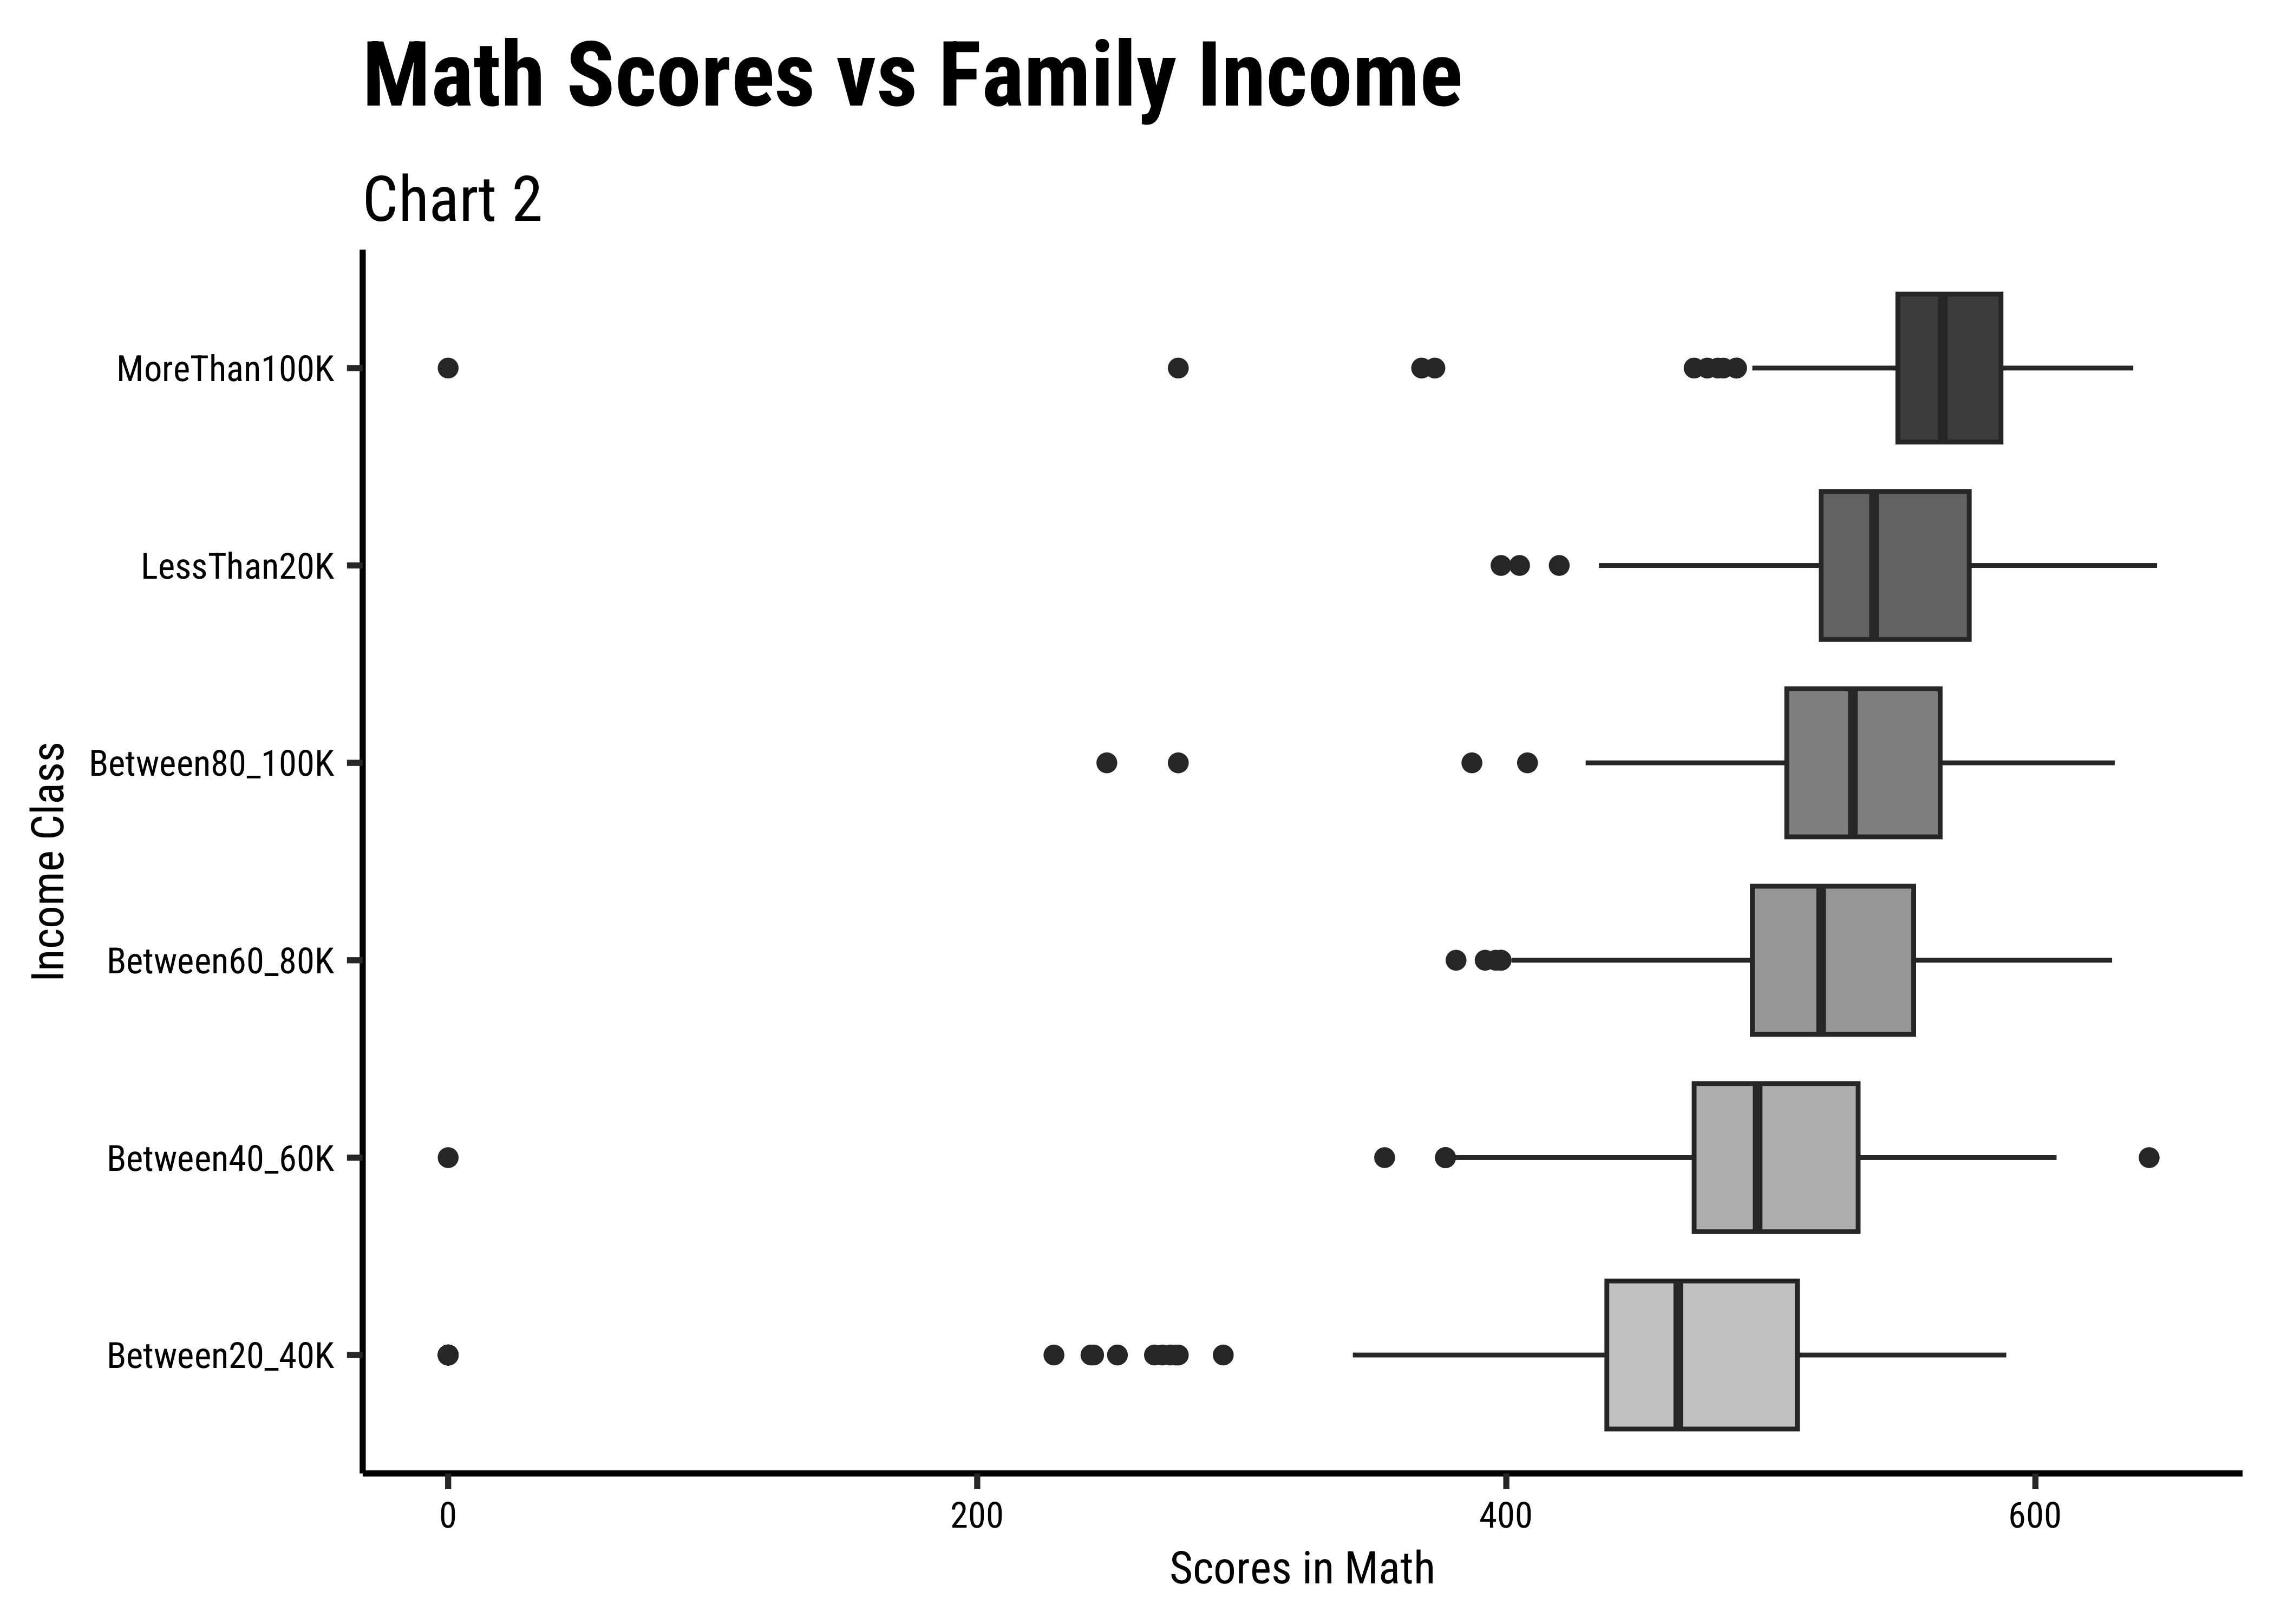
Plot the Data: Maths vs Family Income
names <fct> | values <dbl> | |||
|---|---|---|---|---|
| Between20_40K | 513 | |||
| Between40_60K | 539 | |||
| Between60_80K | 550 | |||
| Between80_100K | 566 | |||
| LessThan20K | 462 | |||
| MoreThan100K | 588 | |||
| Between20_40K | 492 | |||
| Between40_60K | 517 | |||
| Between60_80K | 513 | |||
| Between80_100K | 528 |
Task and Discussion
Complete the Data Dictionary. Select and Transform the variables as shown. Create the graphs shown below and discuss the following questions:
- Identify the type of charts
- Identify the variables used for various geometrical aspects (x, y, fill…). Name the variables appropriately.
- What activity might have been carried out to obtain the data graphed here? Provide some details.
- What might have been the Hypothesis/Research Question to which the response was Chart #1?
- And Chart #2
- Write a 2-line story based on each of the graphs, describing your inference/surprise.