Show the Code
penguins %>% gf_point(body_mass_g ~ flipper_length_mm, colour = ~species)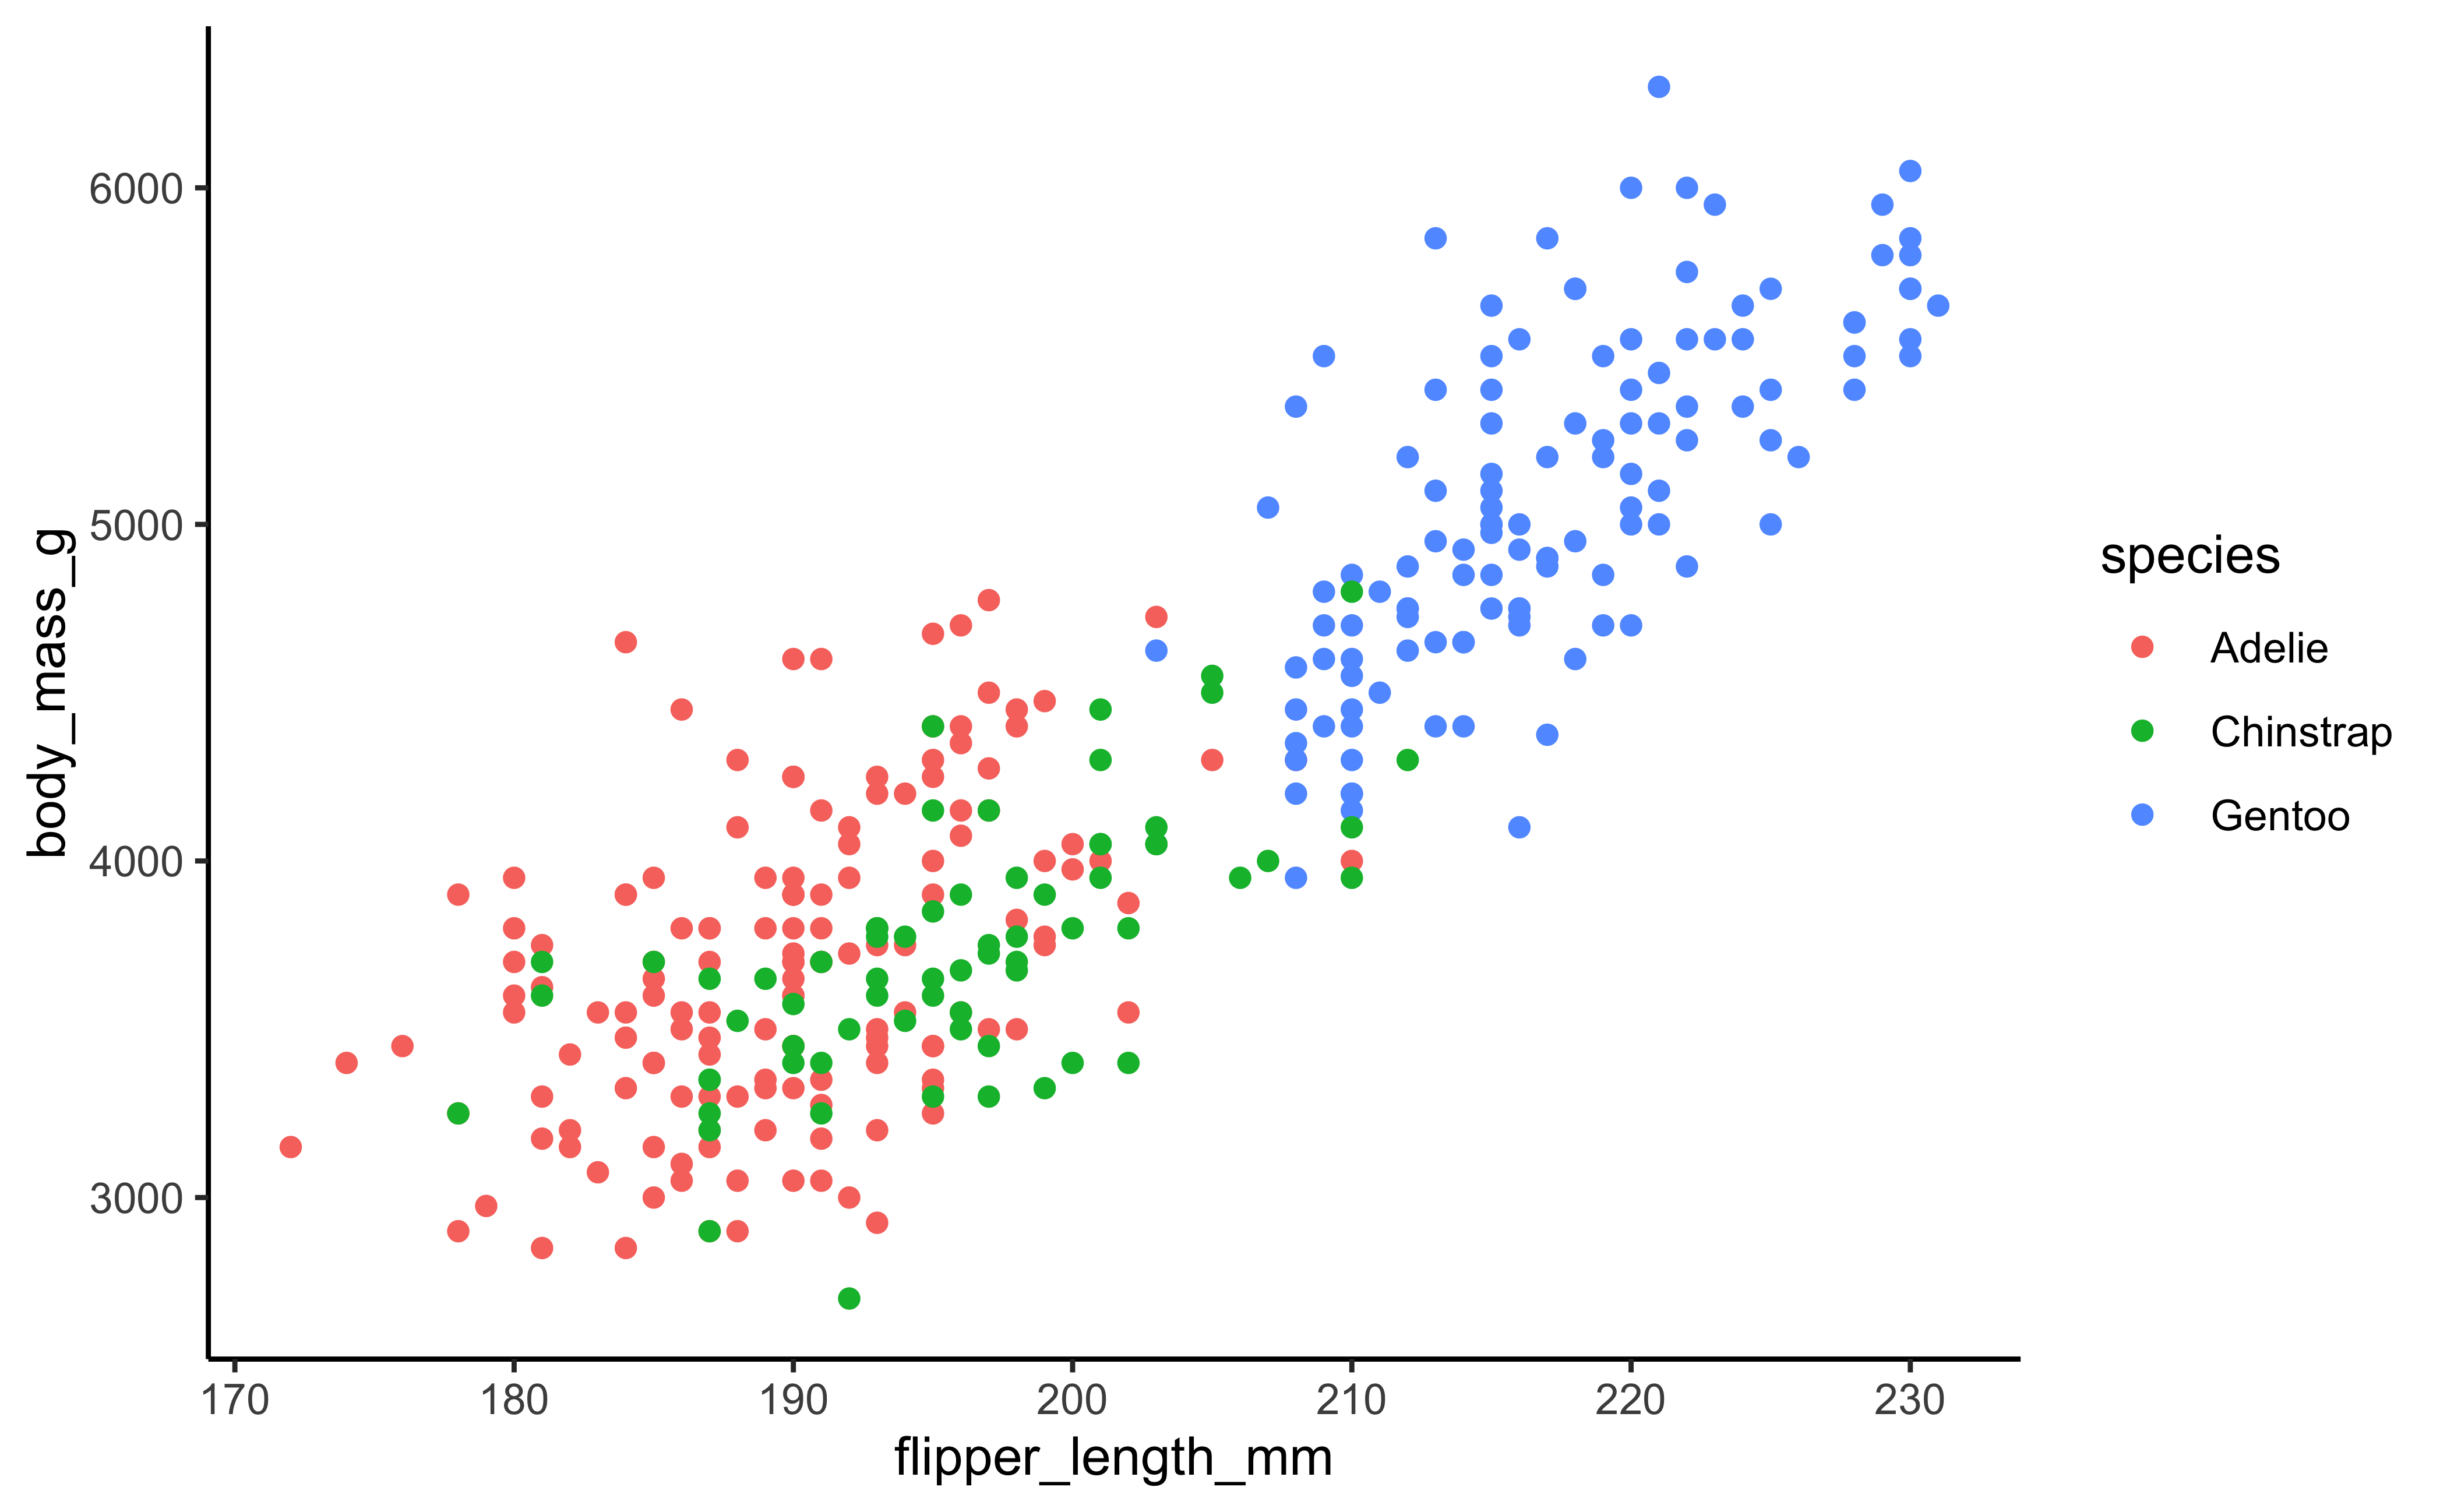
Alert - I have split up this Huge website into smaller ones. Please check out the new site URLs on the Home page for the latest course content. This website will not be updated anymore. Thanks for your patience and support! 🙏
penguins %>% gf_point(body_mass_g ~ flipper_length_mm, colour = ~species)
library(p5)
library(tibble)

# Create drawings from data frames

squares <- data_frame(
  x = c(100, 100, 200, 200),
  y = c(50, 150, 50, 150),
  w = rep(40, 4),
  h = rep(40, 4)
)

squares %>%
  p5() %>%
  createCanvas(300, 200) %>%
  background("#002d72") %>%
  rect()
# Draw complex shapes
p5() %>%
createCanvas(200, 200) %>%
background("#DCDCDC") %>%
arc(50, 55, 50, 50, 0, ~HALF_PI) %>%
noFill() %>%
arc(50, 55, 60, 60, ~HALF_PI, ~PI) %>%
arc(50, 55, 70, 70, ~PI, ~ PI + QUARTER_PI) %>%
arc(50, 55, 80, 80, ~ PI + QUARTER_PI, ~TWO_PI)# Create a sketch piece-by-piece
squares %>%
draw() %>%
fill("#808080") %>%
rect() %>%
sketch(
draw = .,
setup = setup() %>% createCanvas(300, 200)
)# Create interactions
draw() %>%
background("#F4F8FC") %>%
line(~mouseX, 0, ~mouseX, 200) %>%
sketch(
draw = .,
setup = setup() %>% createCanvas(300, 200)
)# Let users draw
p5() %>%
createCanvas(400, 300) %>%
background("#F4F8FC") %>%
ellipse(~mouseX, ~mouseY, 30, 30)# Click to change the brush
setup_ <- setup() %>%
createCanvas(640, 380, ~WEBGL)
draw_ <- draw() %>%
js("
if (mouseIsPressed) {
fill(0);
} else {
fill(255);
}
") %>%
ellipse(~mouseX, ~mouseY, 80, 80)
sketch(setup = setup_, draw = draw_)Classification is a Machine Learning method that predicts the class or level of a target Qualitative variable, based on several Qualitative and Quantitative predictors.
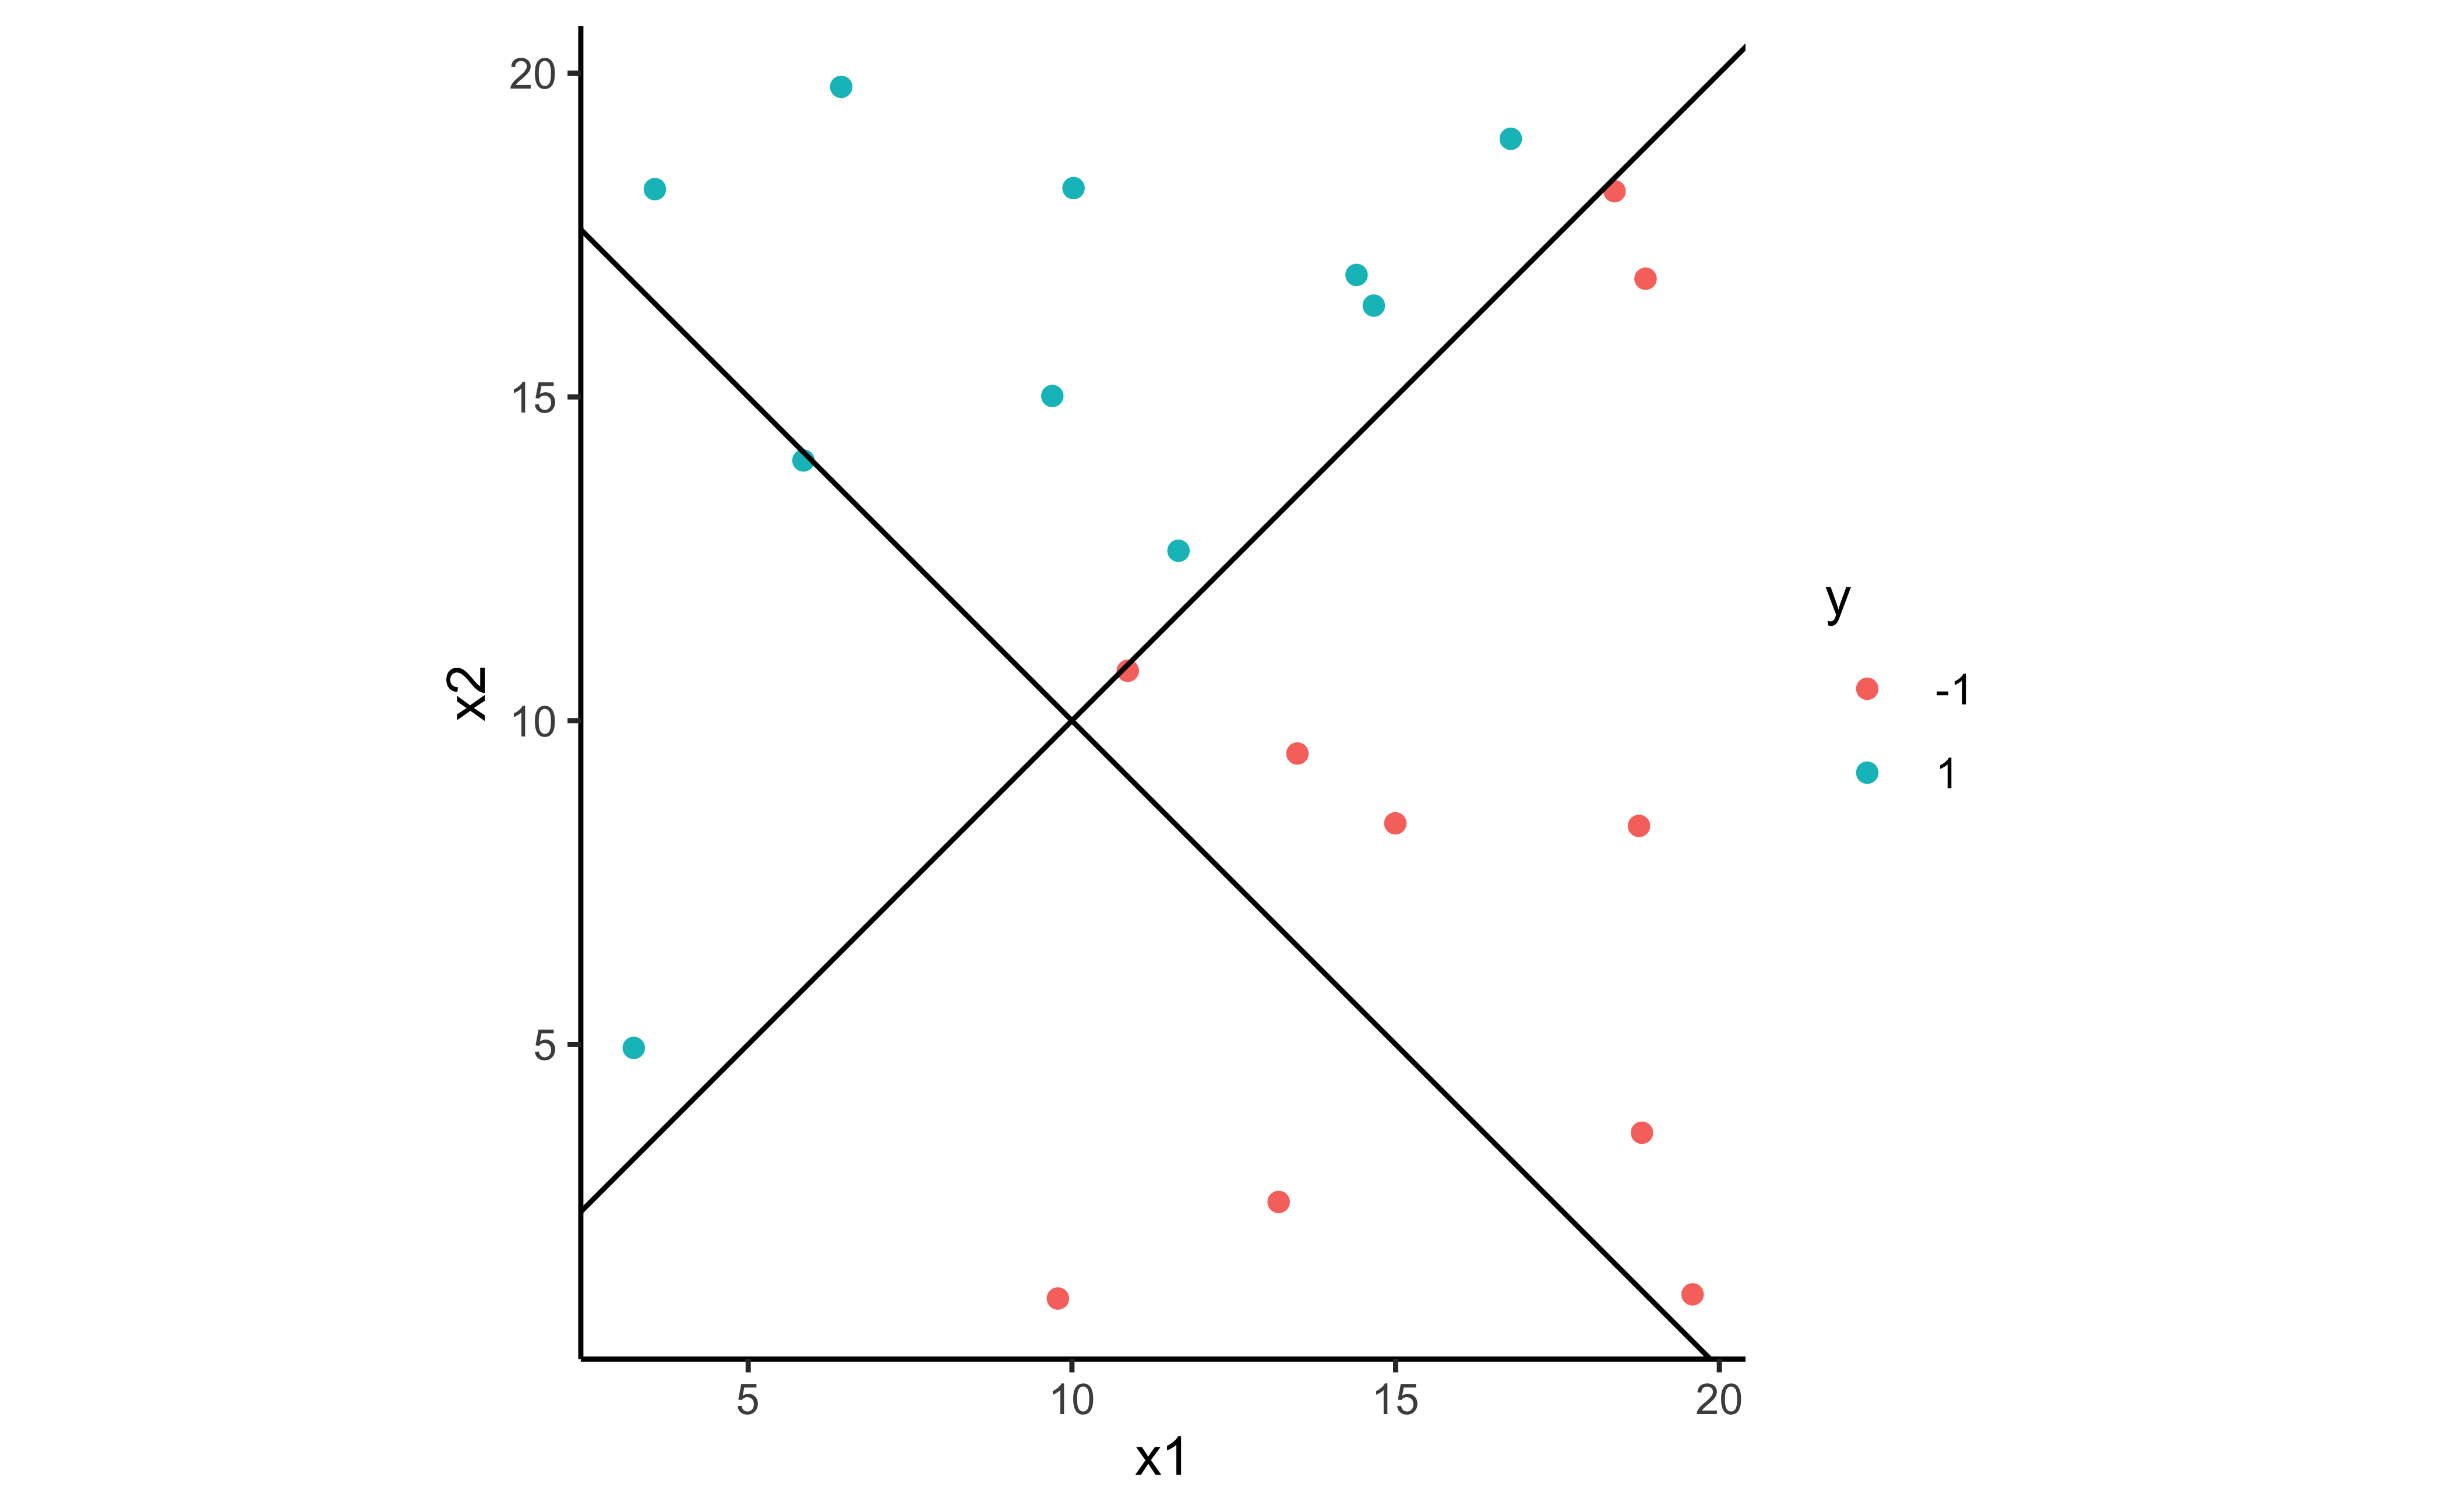
Consider a dataset that contains a pair of Quantitative predictor variables and a target Qualitative variable.
x1 <dbl> | x2 <dbl> | y <fct> | ||
|---|---|---|---|---|
| 18.381315 | 18.176596 | -1 | ||
| 18.804433 | 3.635493 | -1 | ||
| 6.436651 | 19.788943 | 1 | ||
| 16.778505 | 18.986696 | 1 | ||
| 13.193165 | 2.566314 | -1 | ||
| 10.862823 | 10.770024 | -1 | ||
| 14.995178 | 8.413866 | -1 | ||
| 3.558665 | 18.209024 | 1 | ||
| 13.482854 | 9.492423 | -1 | ||
| 14.396231 | 16.884081 | 1 |