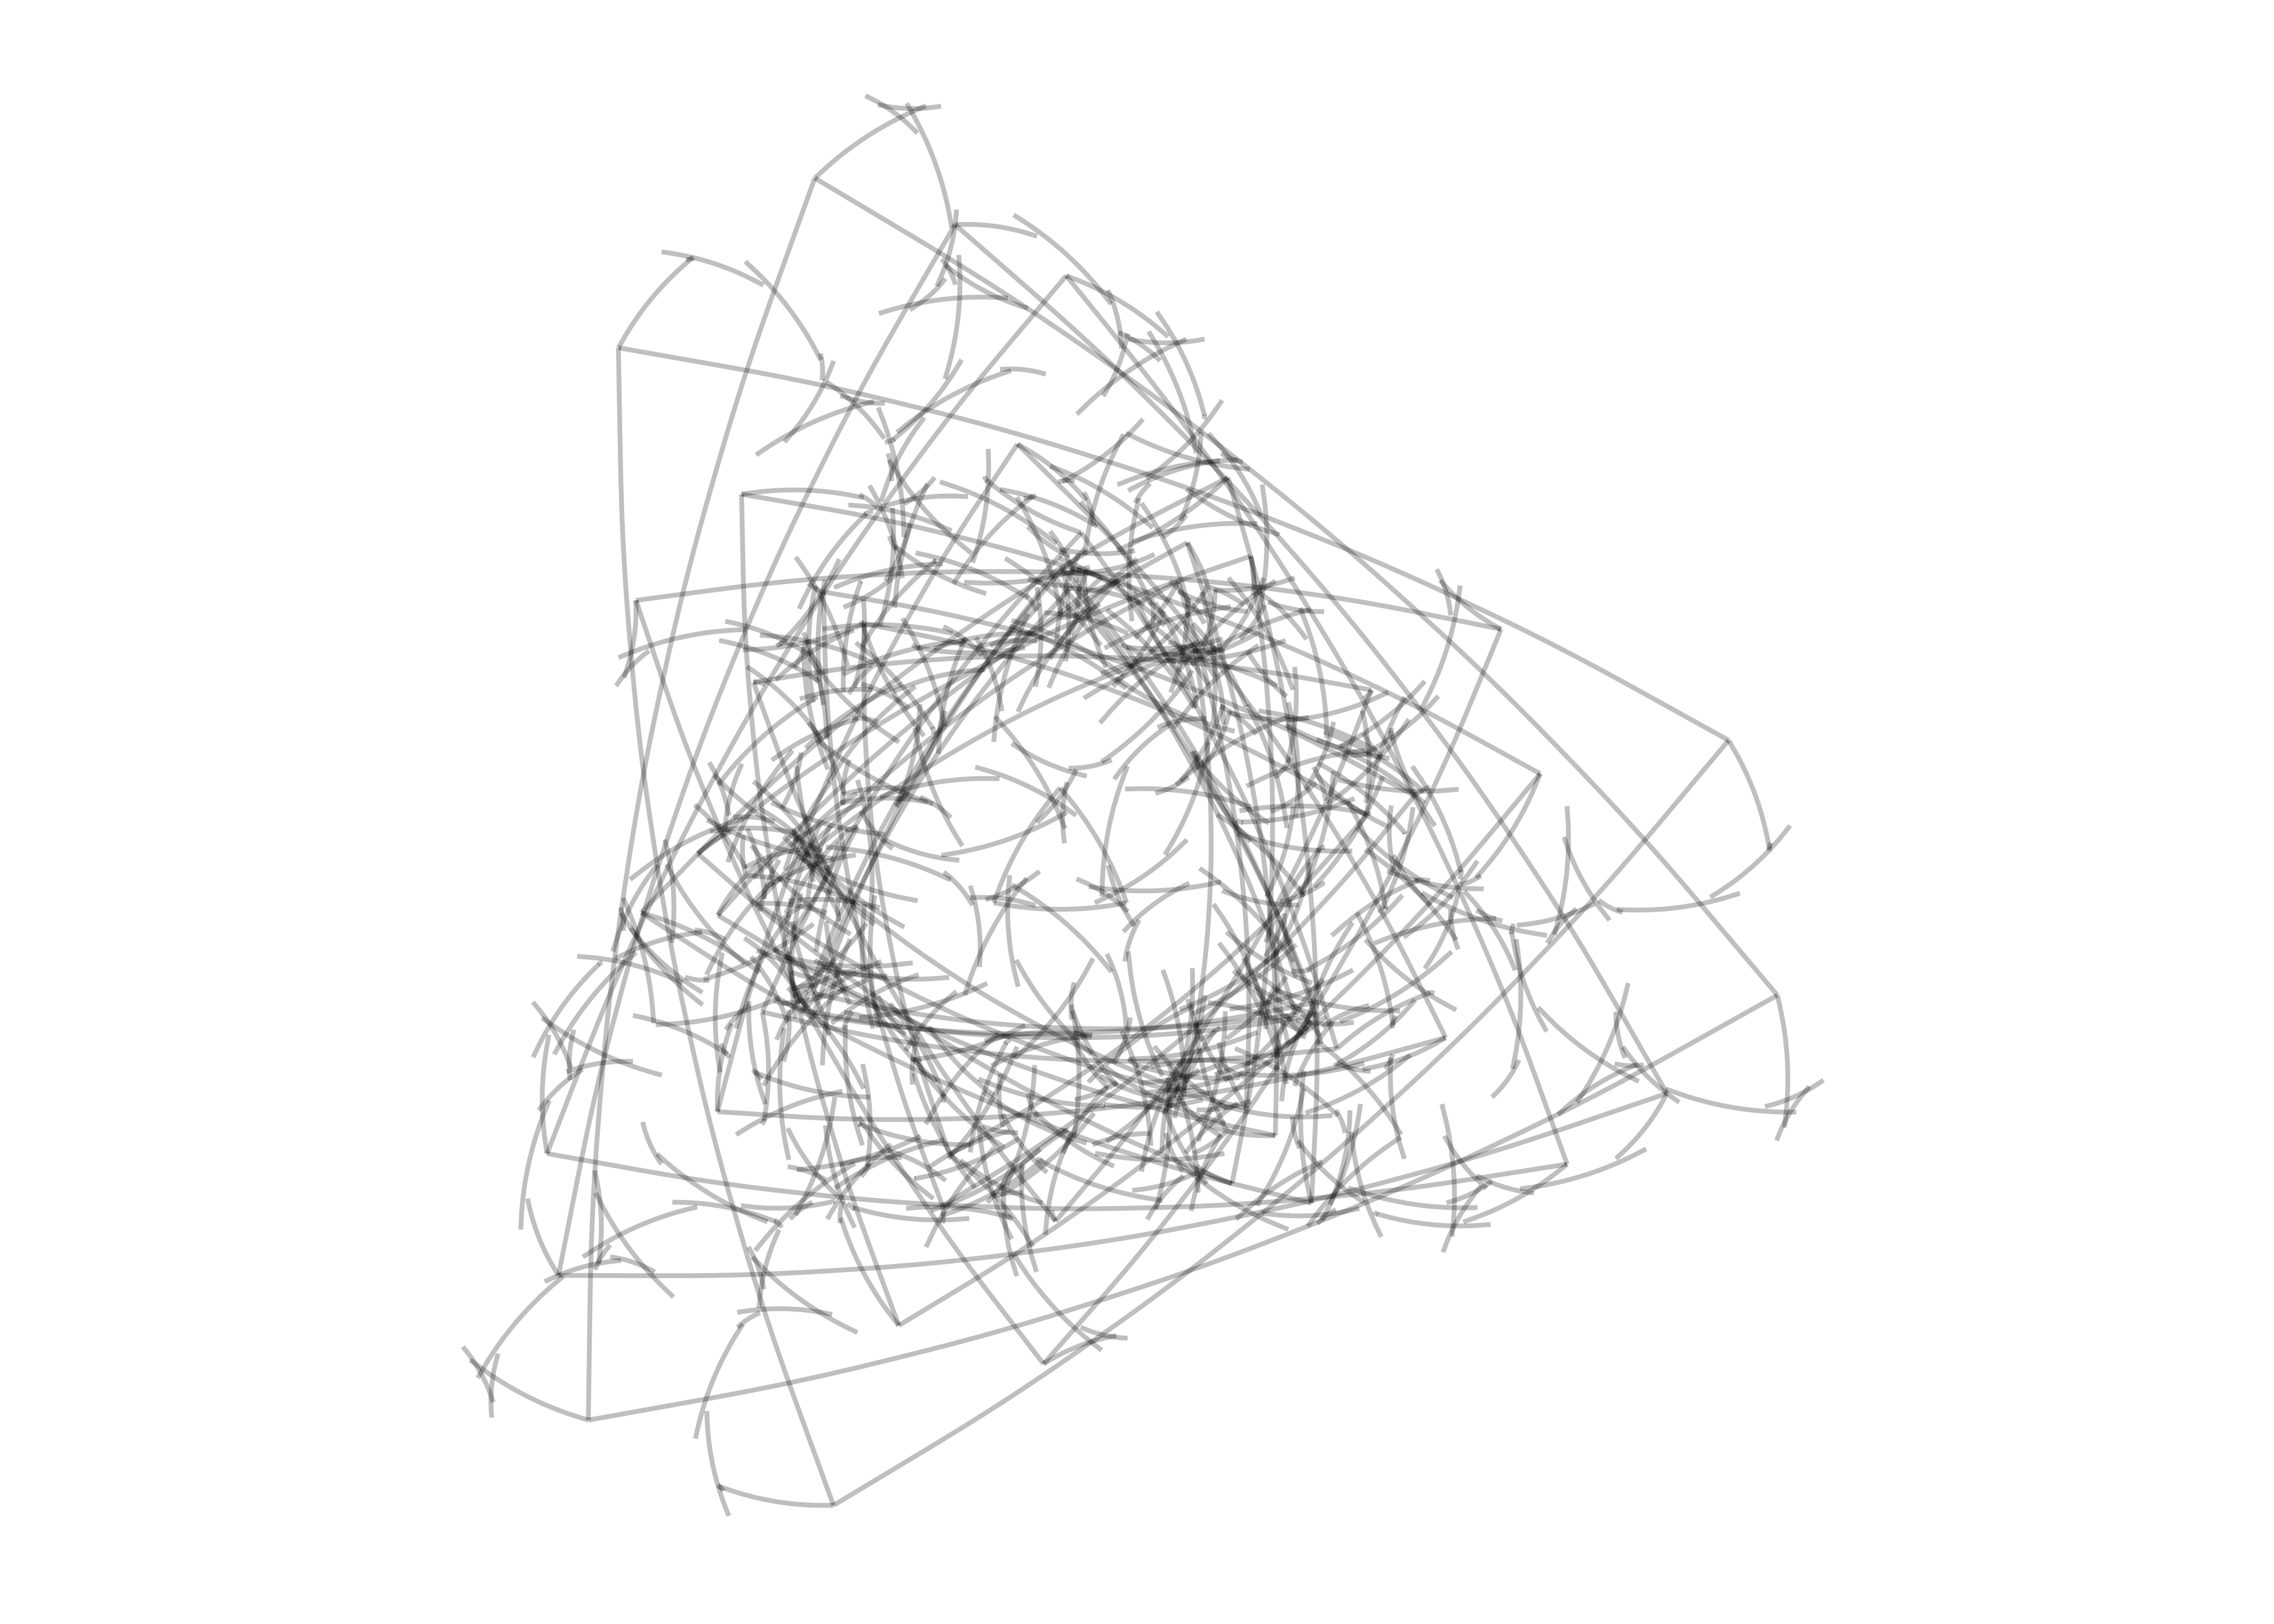
Drawing with purrr
# This function creates the segments of the original polygon
polygon <- function(n) {
  tibble(
    x    = accumulate(1:(n - 1), ~ .x + cos(.y * 2 * pi / n), .init = 0),
    y    = accumulate(1:(n - 1), ~ .x + sin(.y * 2 * pi / n), .init = 0),
    xend = accumulate(2:n, ~ .x + cos(.y * 2 * pi / n), .init = cos(2 * pi / n)),
    yend = accumulate(2:n, ~ .x + sin(.y * 2 * pi / n), .init = sin(2 * pi / n))
  )
}
# This function creates segments from some mid-point of the edges
mid_points <- function(d, p, a, i, FUN = ratio_f) {
d %>%
mutate(
angle = atan2(yend - y, xend - x) + a,
radius = FUN(i),
x = p * x + (1 - p) * xend,
y = p * y + (1 - p) * yend,
xend = x + radius * cos(angle),
yend = y + radius * sin(angle)
) %>%
select(x, y, xend, yend)
}edges <- 3 # Number of edges of the original polygon
niter <- 250 # Number of iterations
pond <- 0.24 # Weight to calculate the point on the middle of each edge
step <- 13 # Number of times to draw mid-segments before connect ending points
alph <- 0.25 # transparency of curves in geom_curve
angle <- 0.6 # angle of mid-segment with the edge
curv <- 0.1 # Curvature of curves
line_color <- "black" # Color of curves in geom_curve
back_color <- "white" # Background of the ggplot
ratio_f <- function(x) {
sin(x)
} # To calculate the longitude of mid-segments# Generation on the fly of the dataset
accumulate(
.f = function(old, y) {
if (y %% step != 0) mid_points(old, pond, angle, y) else con_points(old)
}, 1:niter,
.init = polygon(edges)
) %>% bind_rows() -> df# Plot
ggplot(df) +
geom_curve(aes(x = x, y = y, xend = xend, yend = yend),
curvature = curv,
color = line_color,
alpha = alph
) +
coord_equal() +
theme(
legend.position = "none",
panel.background = element_rect(fill = back_color),
plot.background = element_rect(fill = back_color),
axis.ticks = element_blank(),
panel.grid = element_blank(),
axis.title = element_blank(),
axis.text = element_blank()
)