Correlation and Regression Explorations
Packages
Intro
I will work through and “unify” at least two things:
- Hadley Wickham’s chapter on modelling and his analysis of the linear model for the diamonds dataset
- The diagnostic aspects of Linear Regression as detailed in Crawley’s book
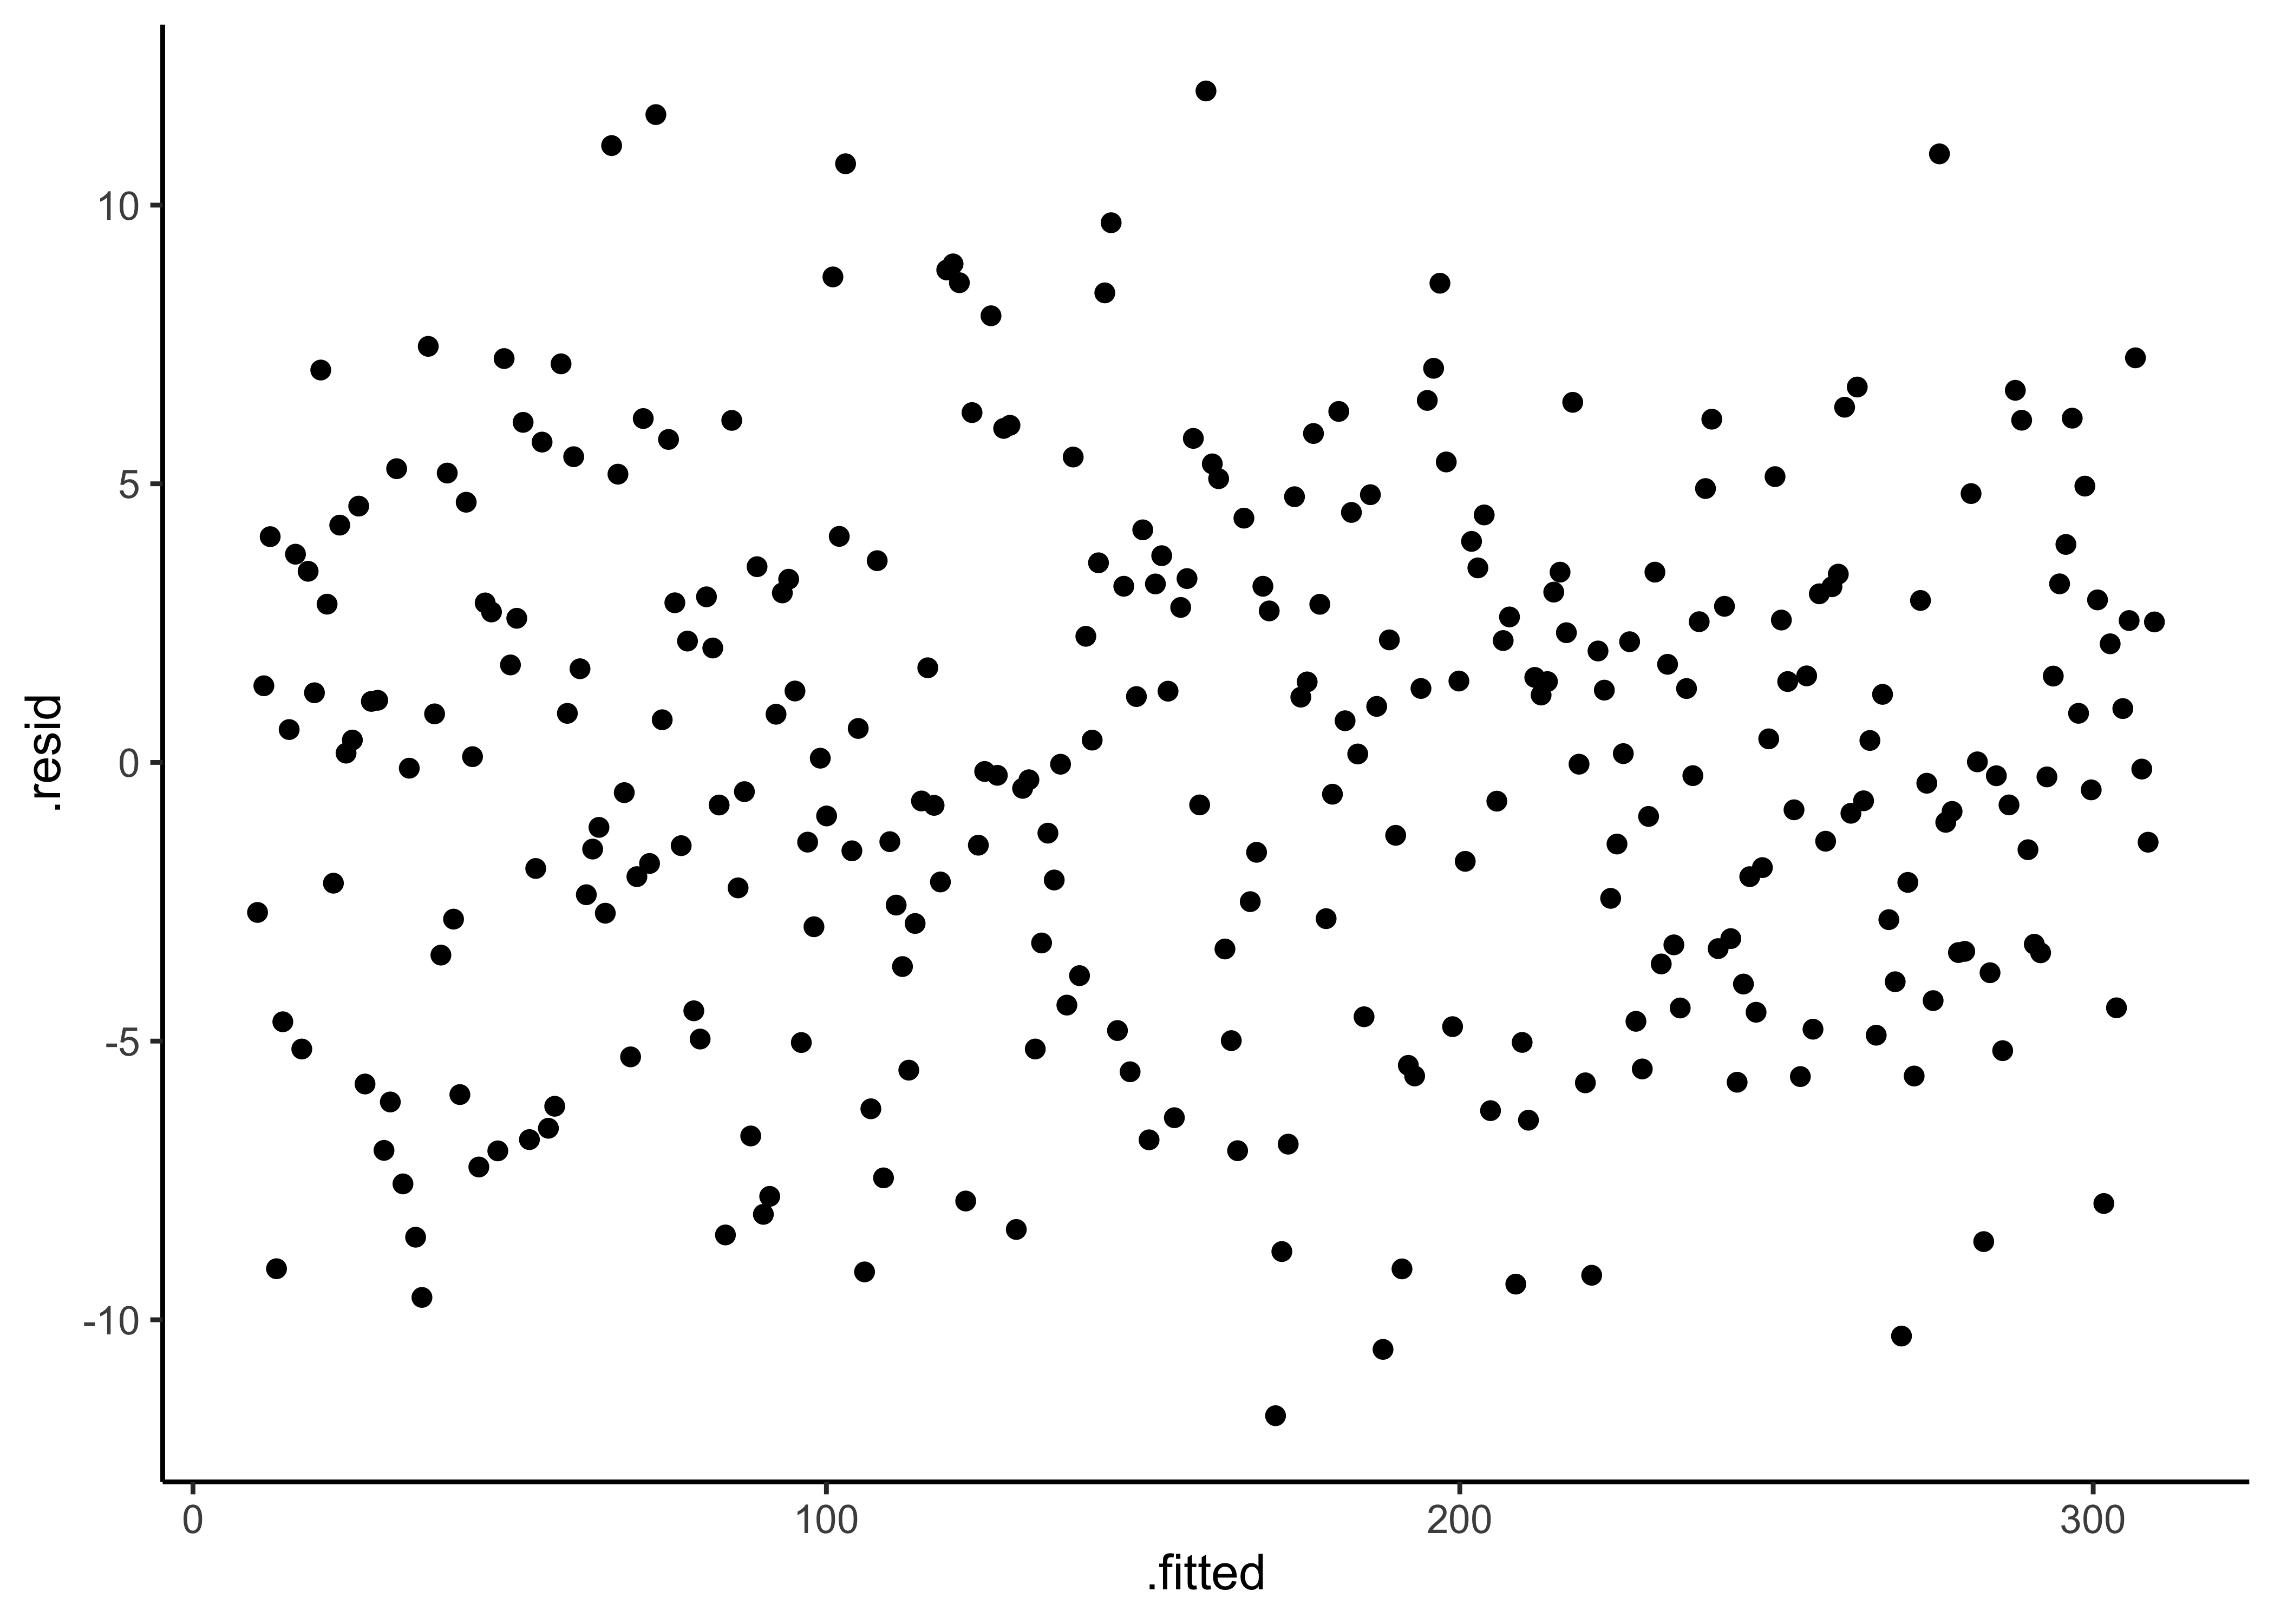
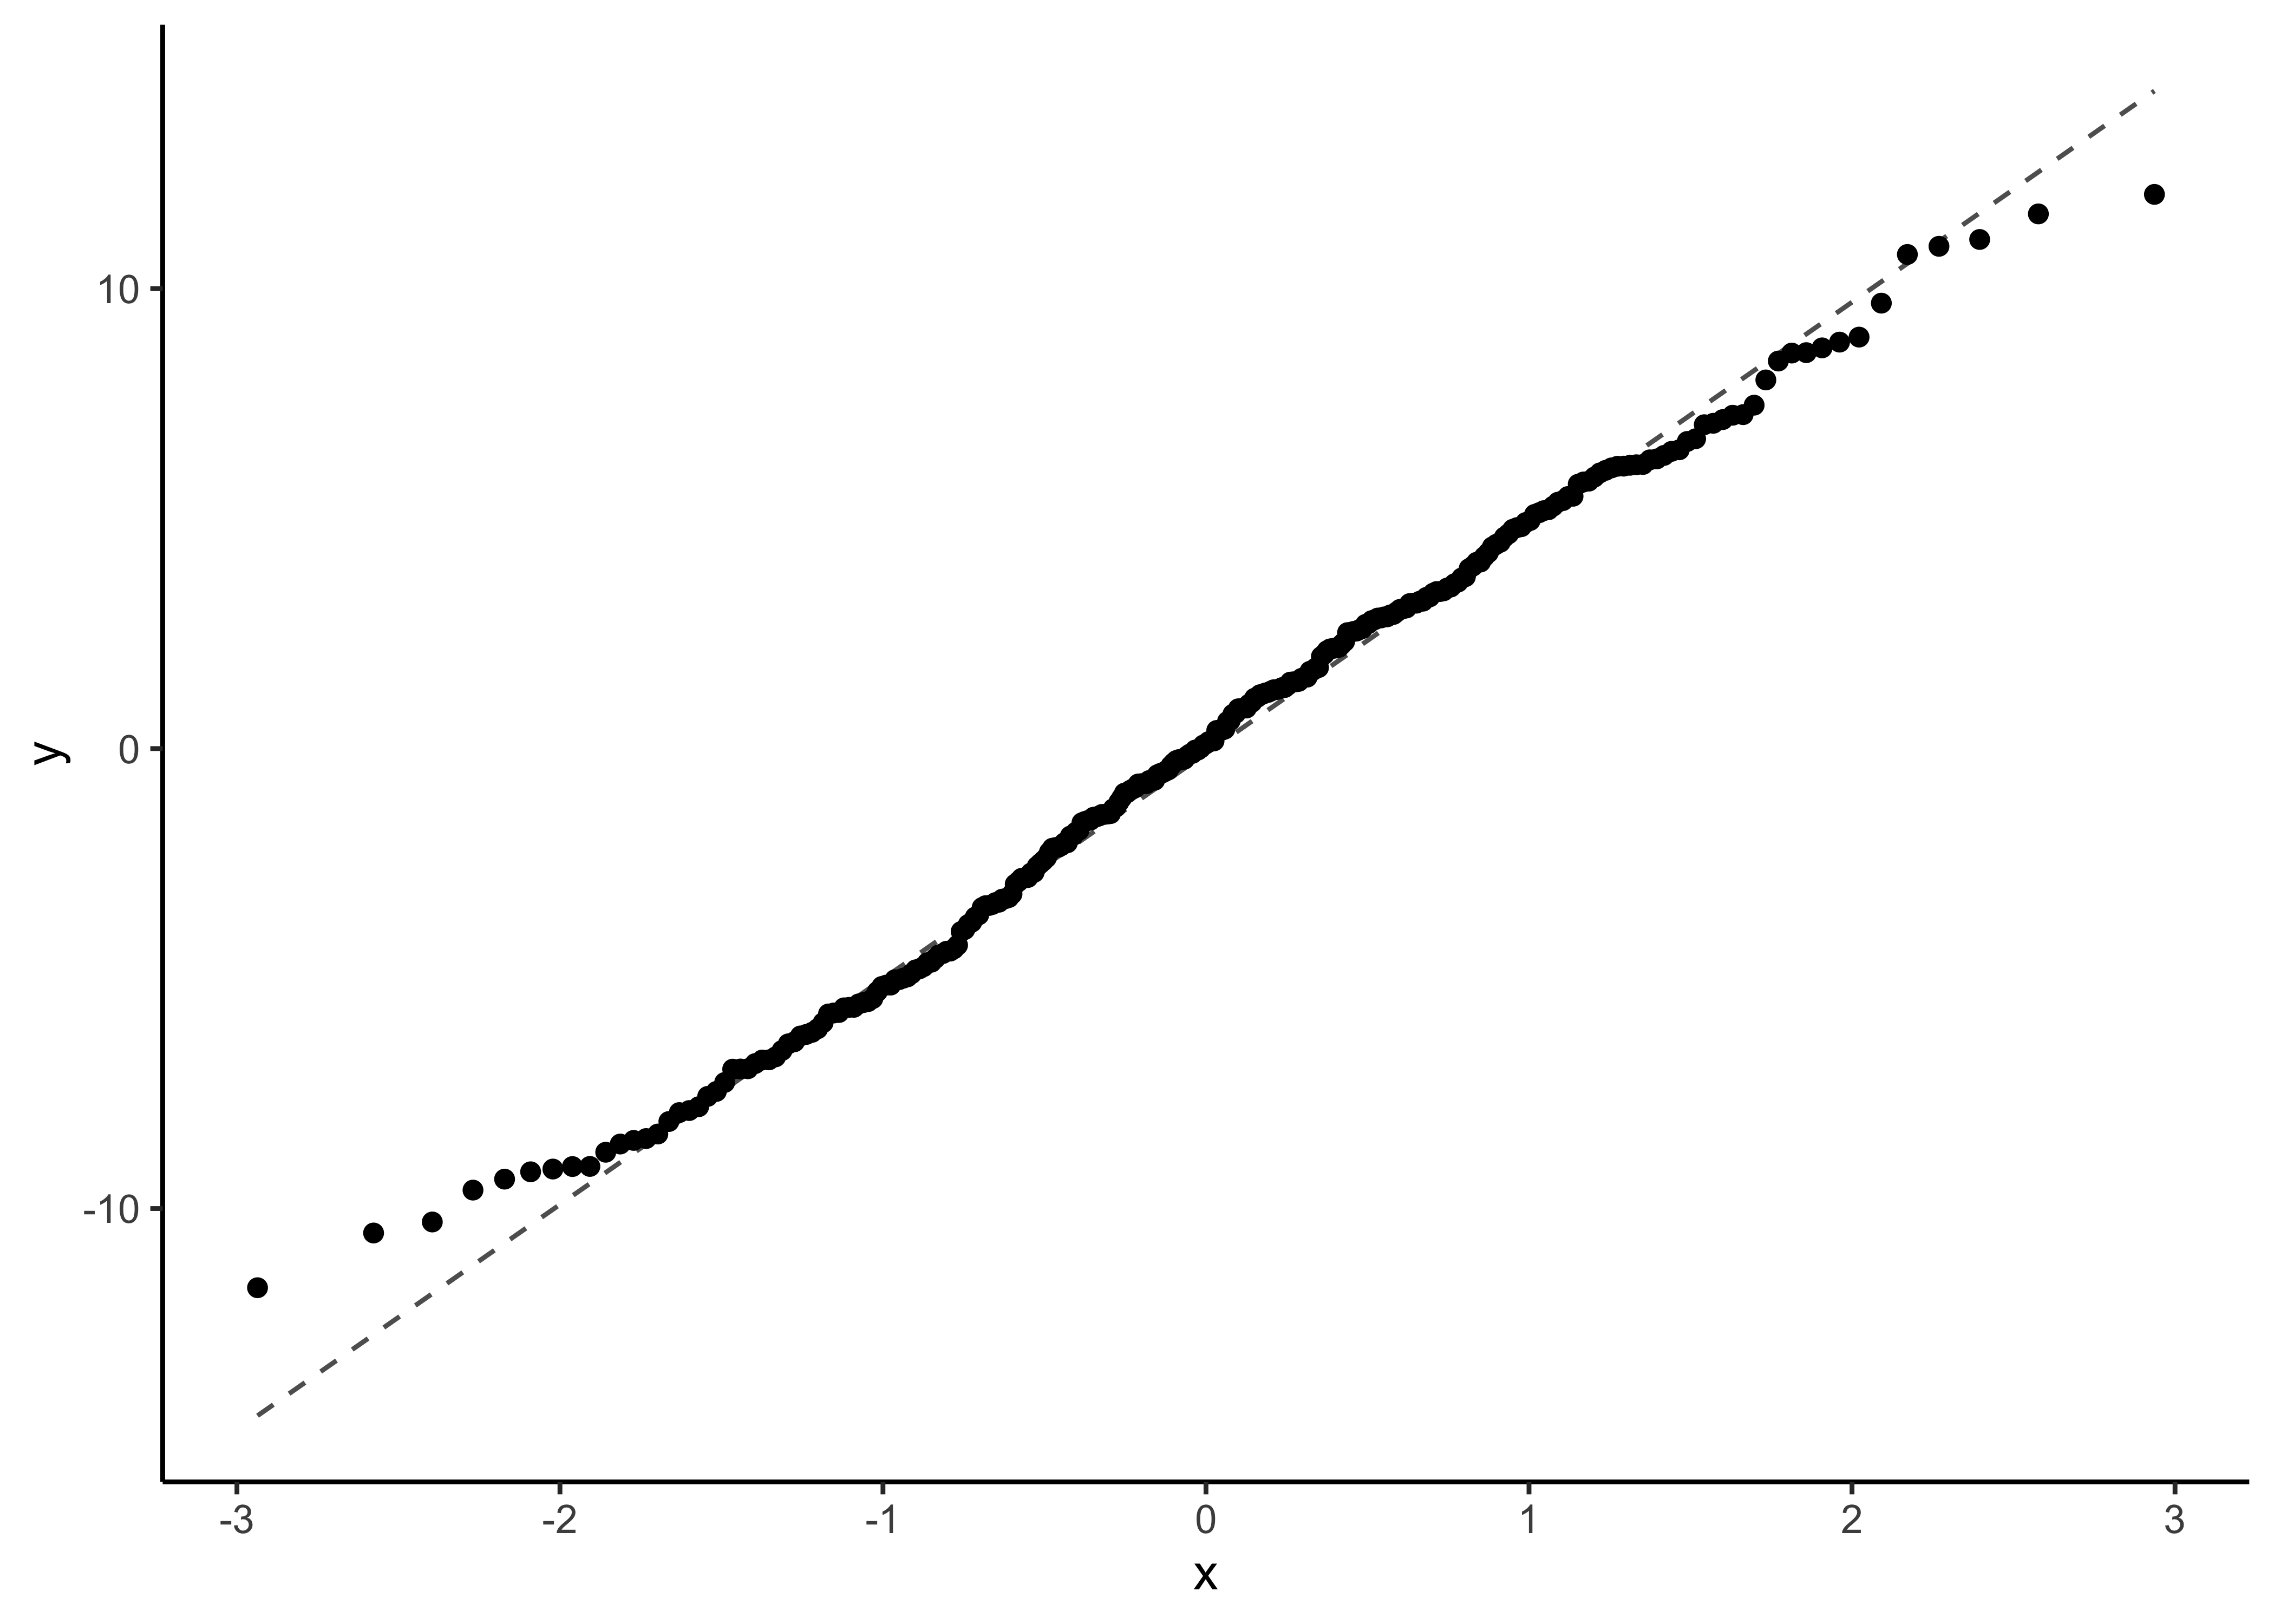
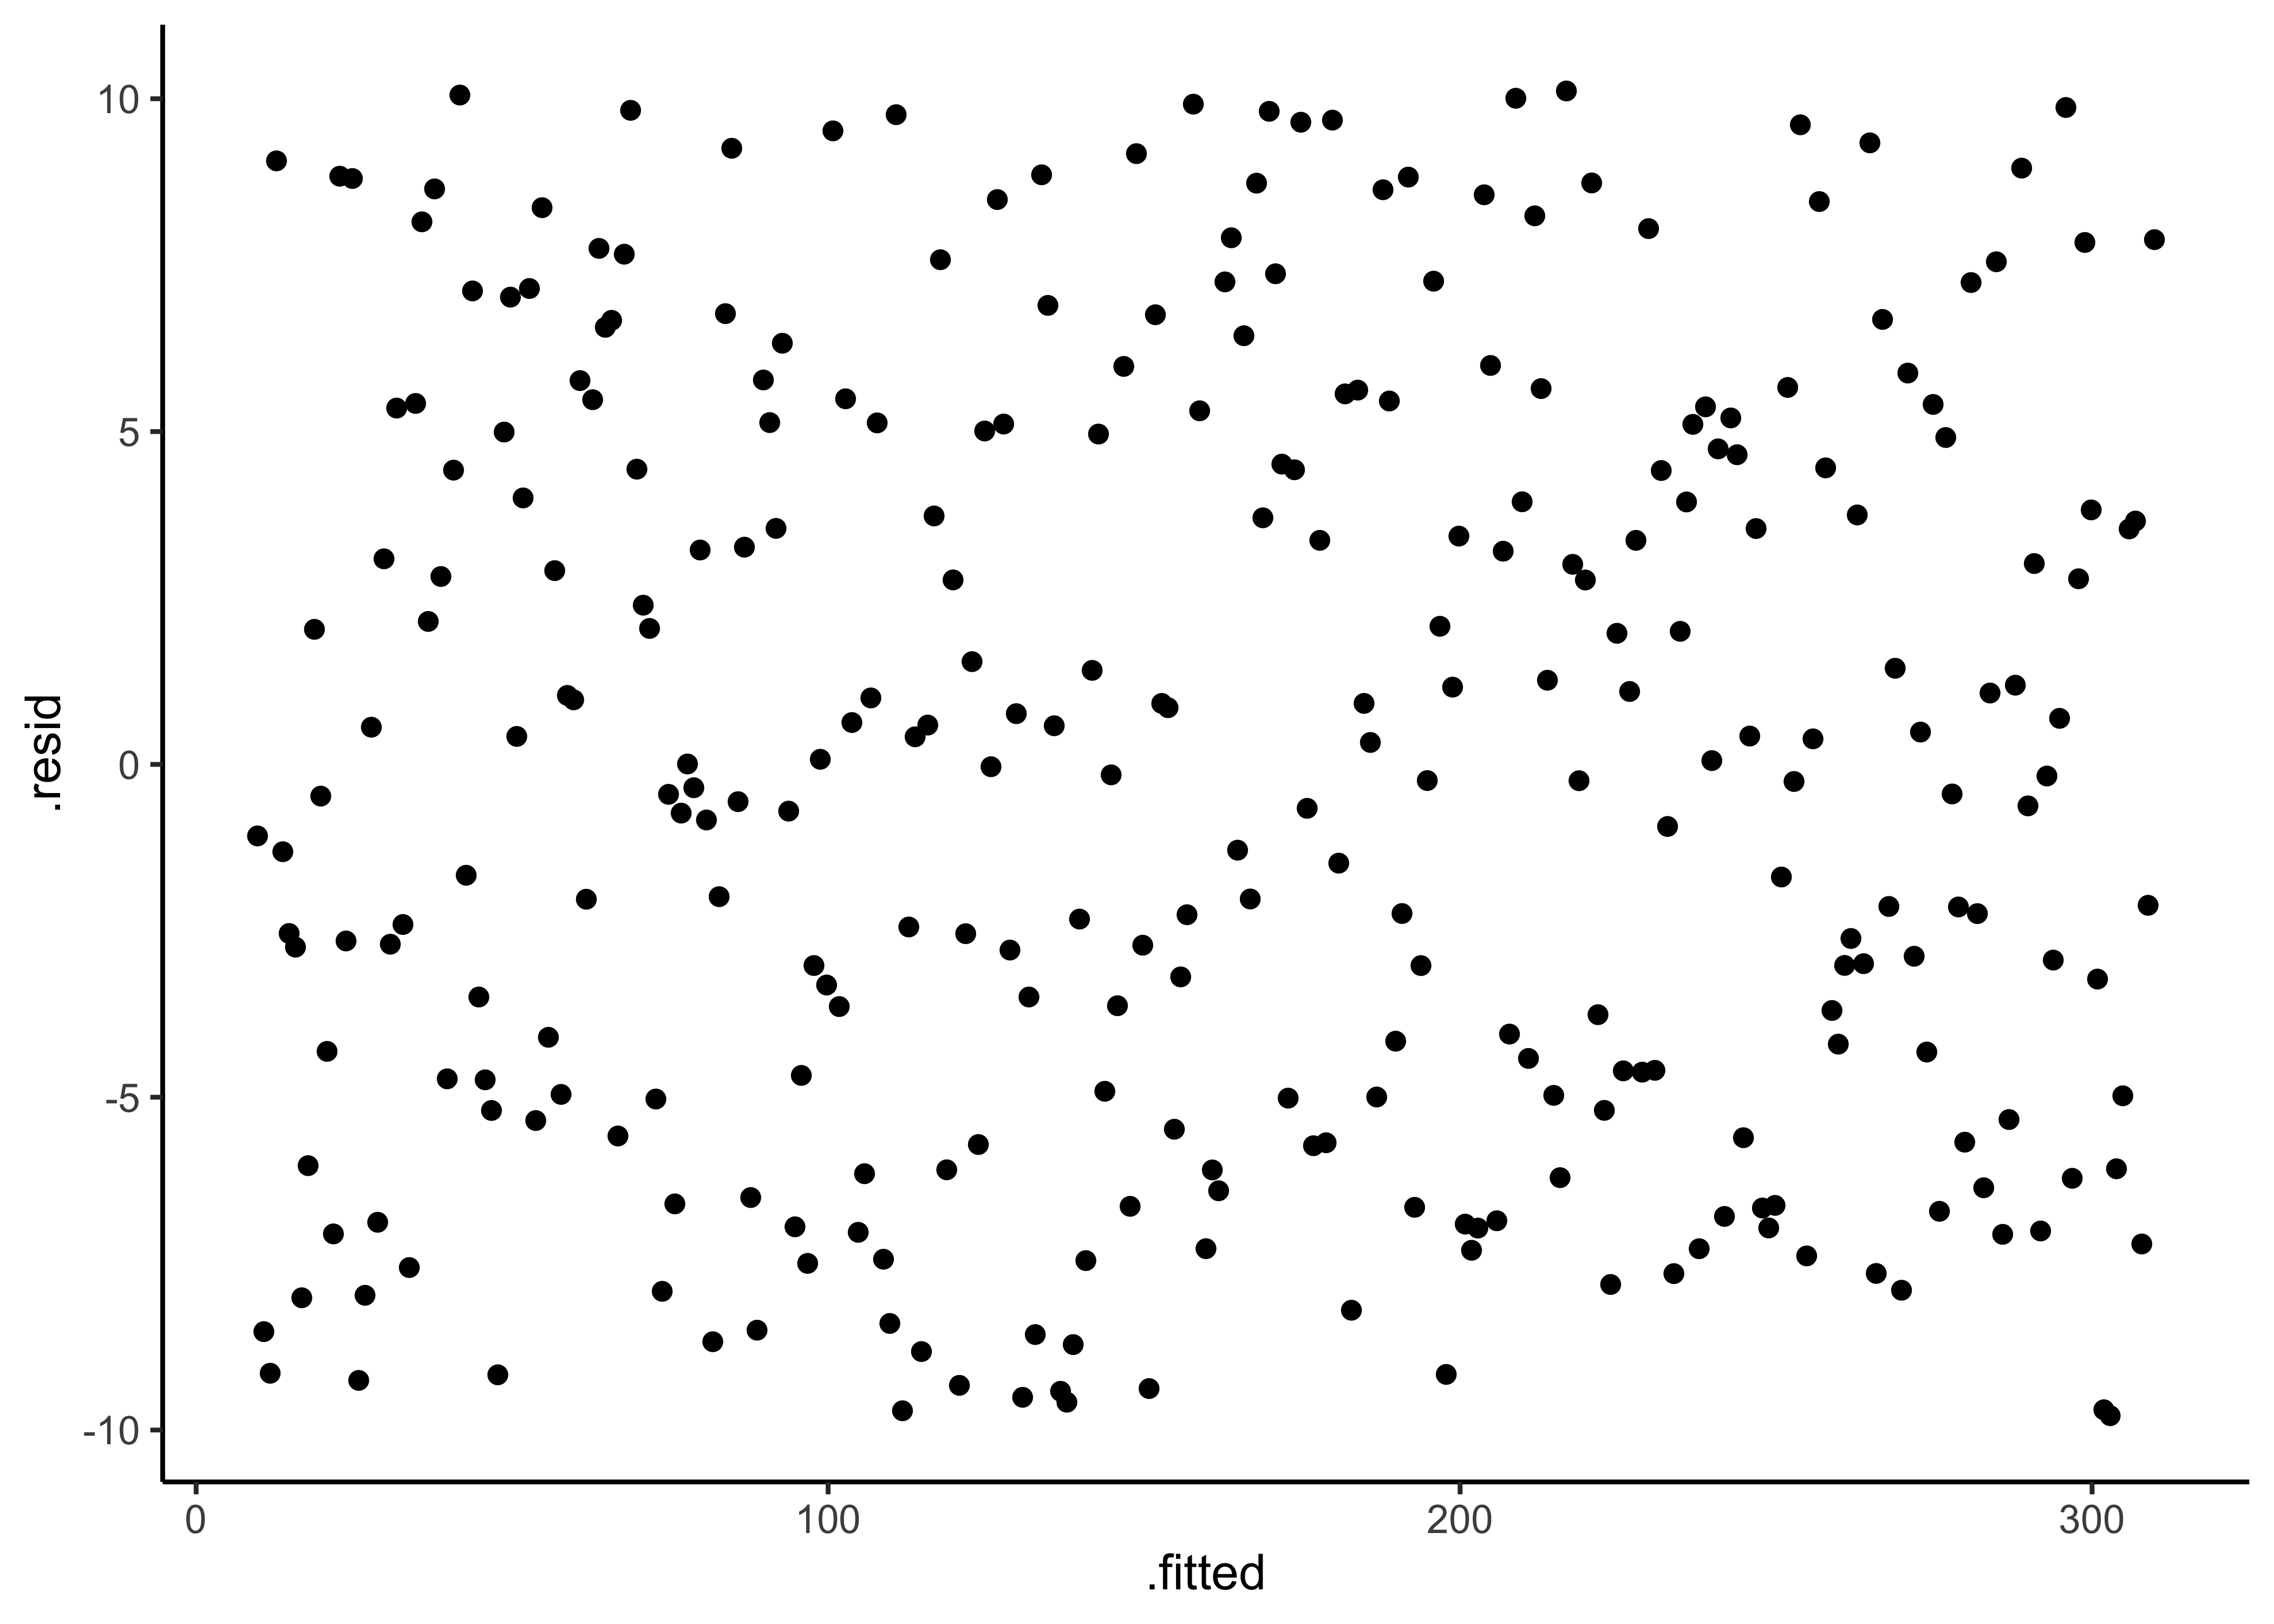
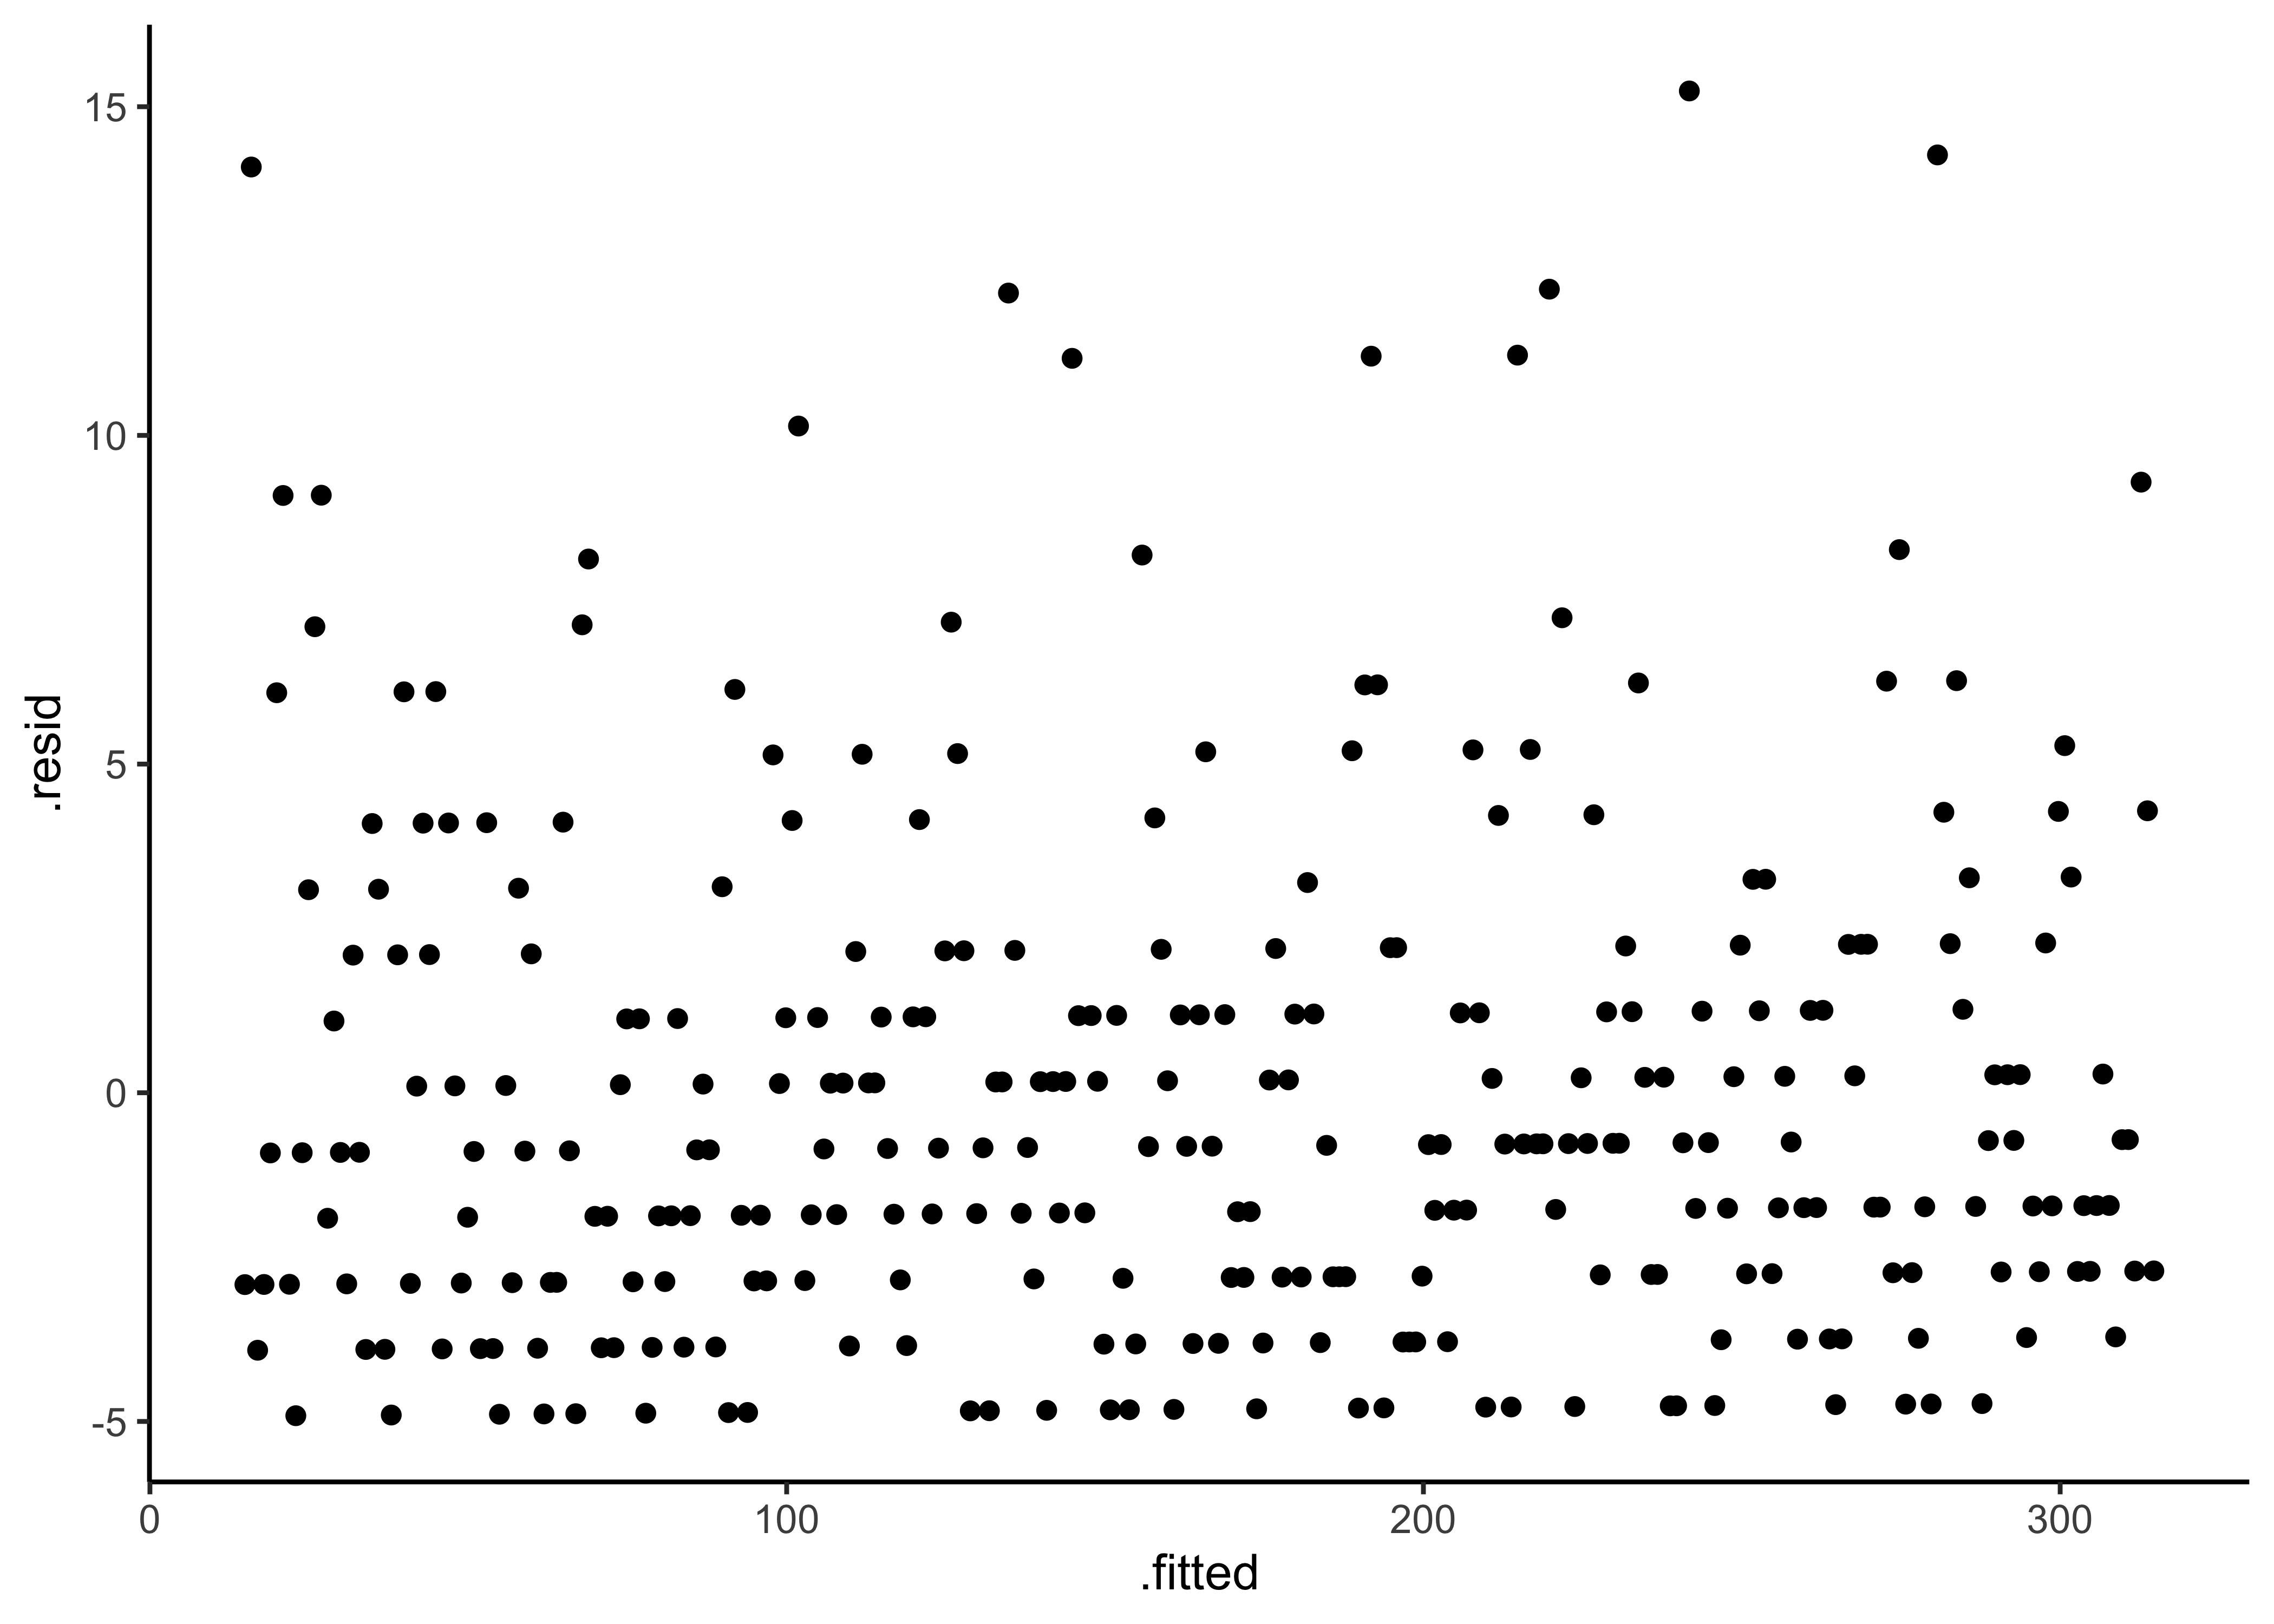
Explorations into Diagnostic Plots
Let us create dependent y* variables with different sorts of errors:
x <- 0:300
en <- rnorm(301, mean = 0, sd = 5)
eu <- (runif(n = 301) - 0.5) * 20
eb <- rnbinom(n = 301, prob = 0.3, size = 2)
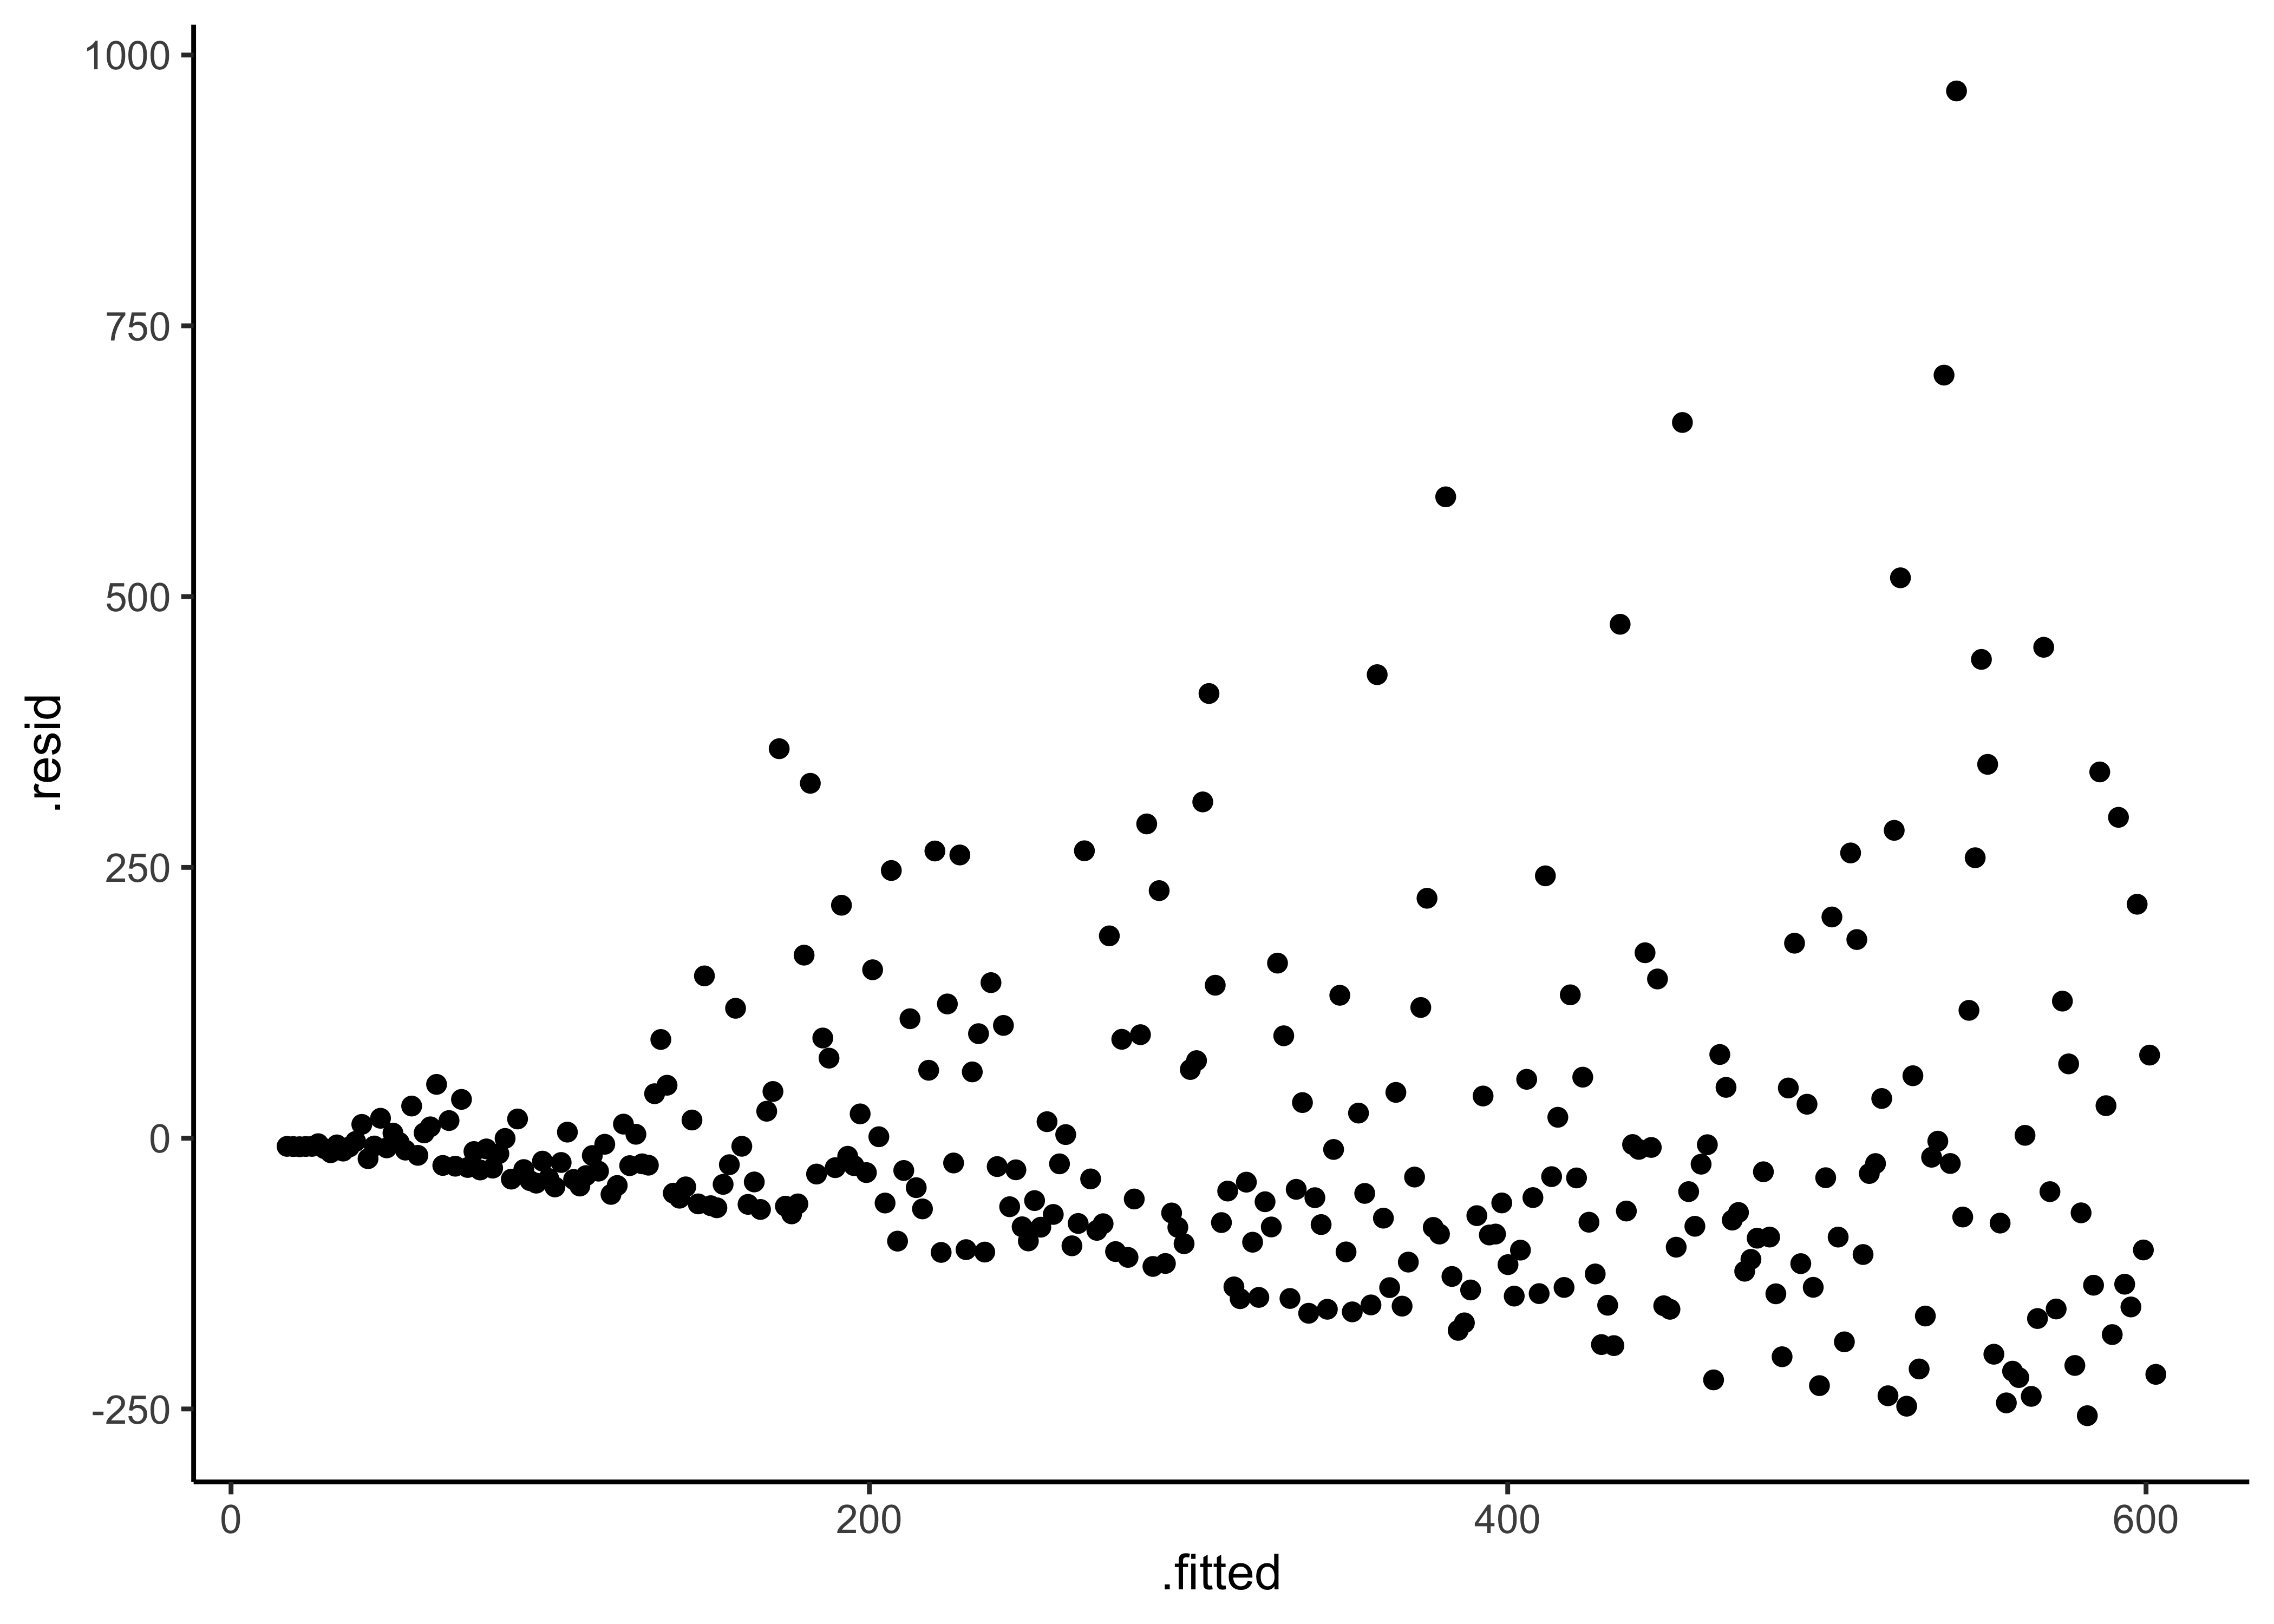
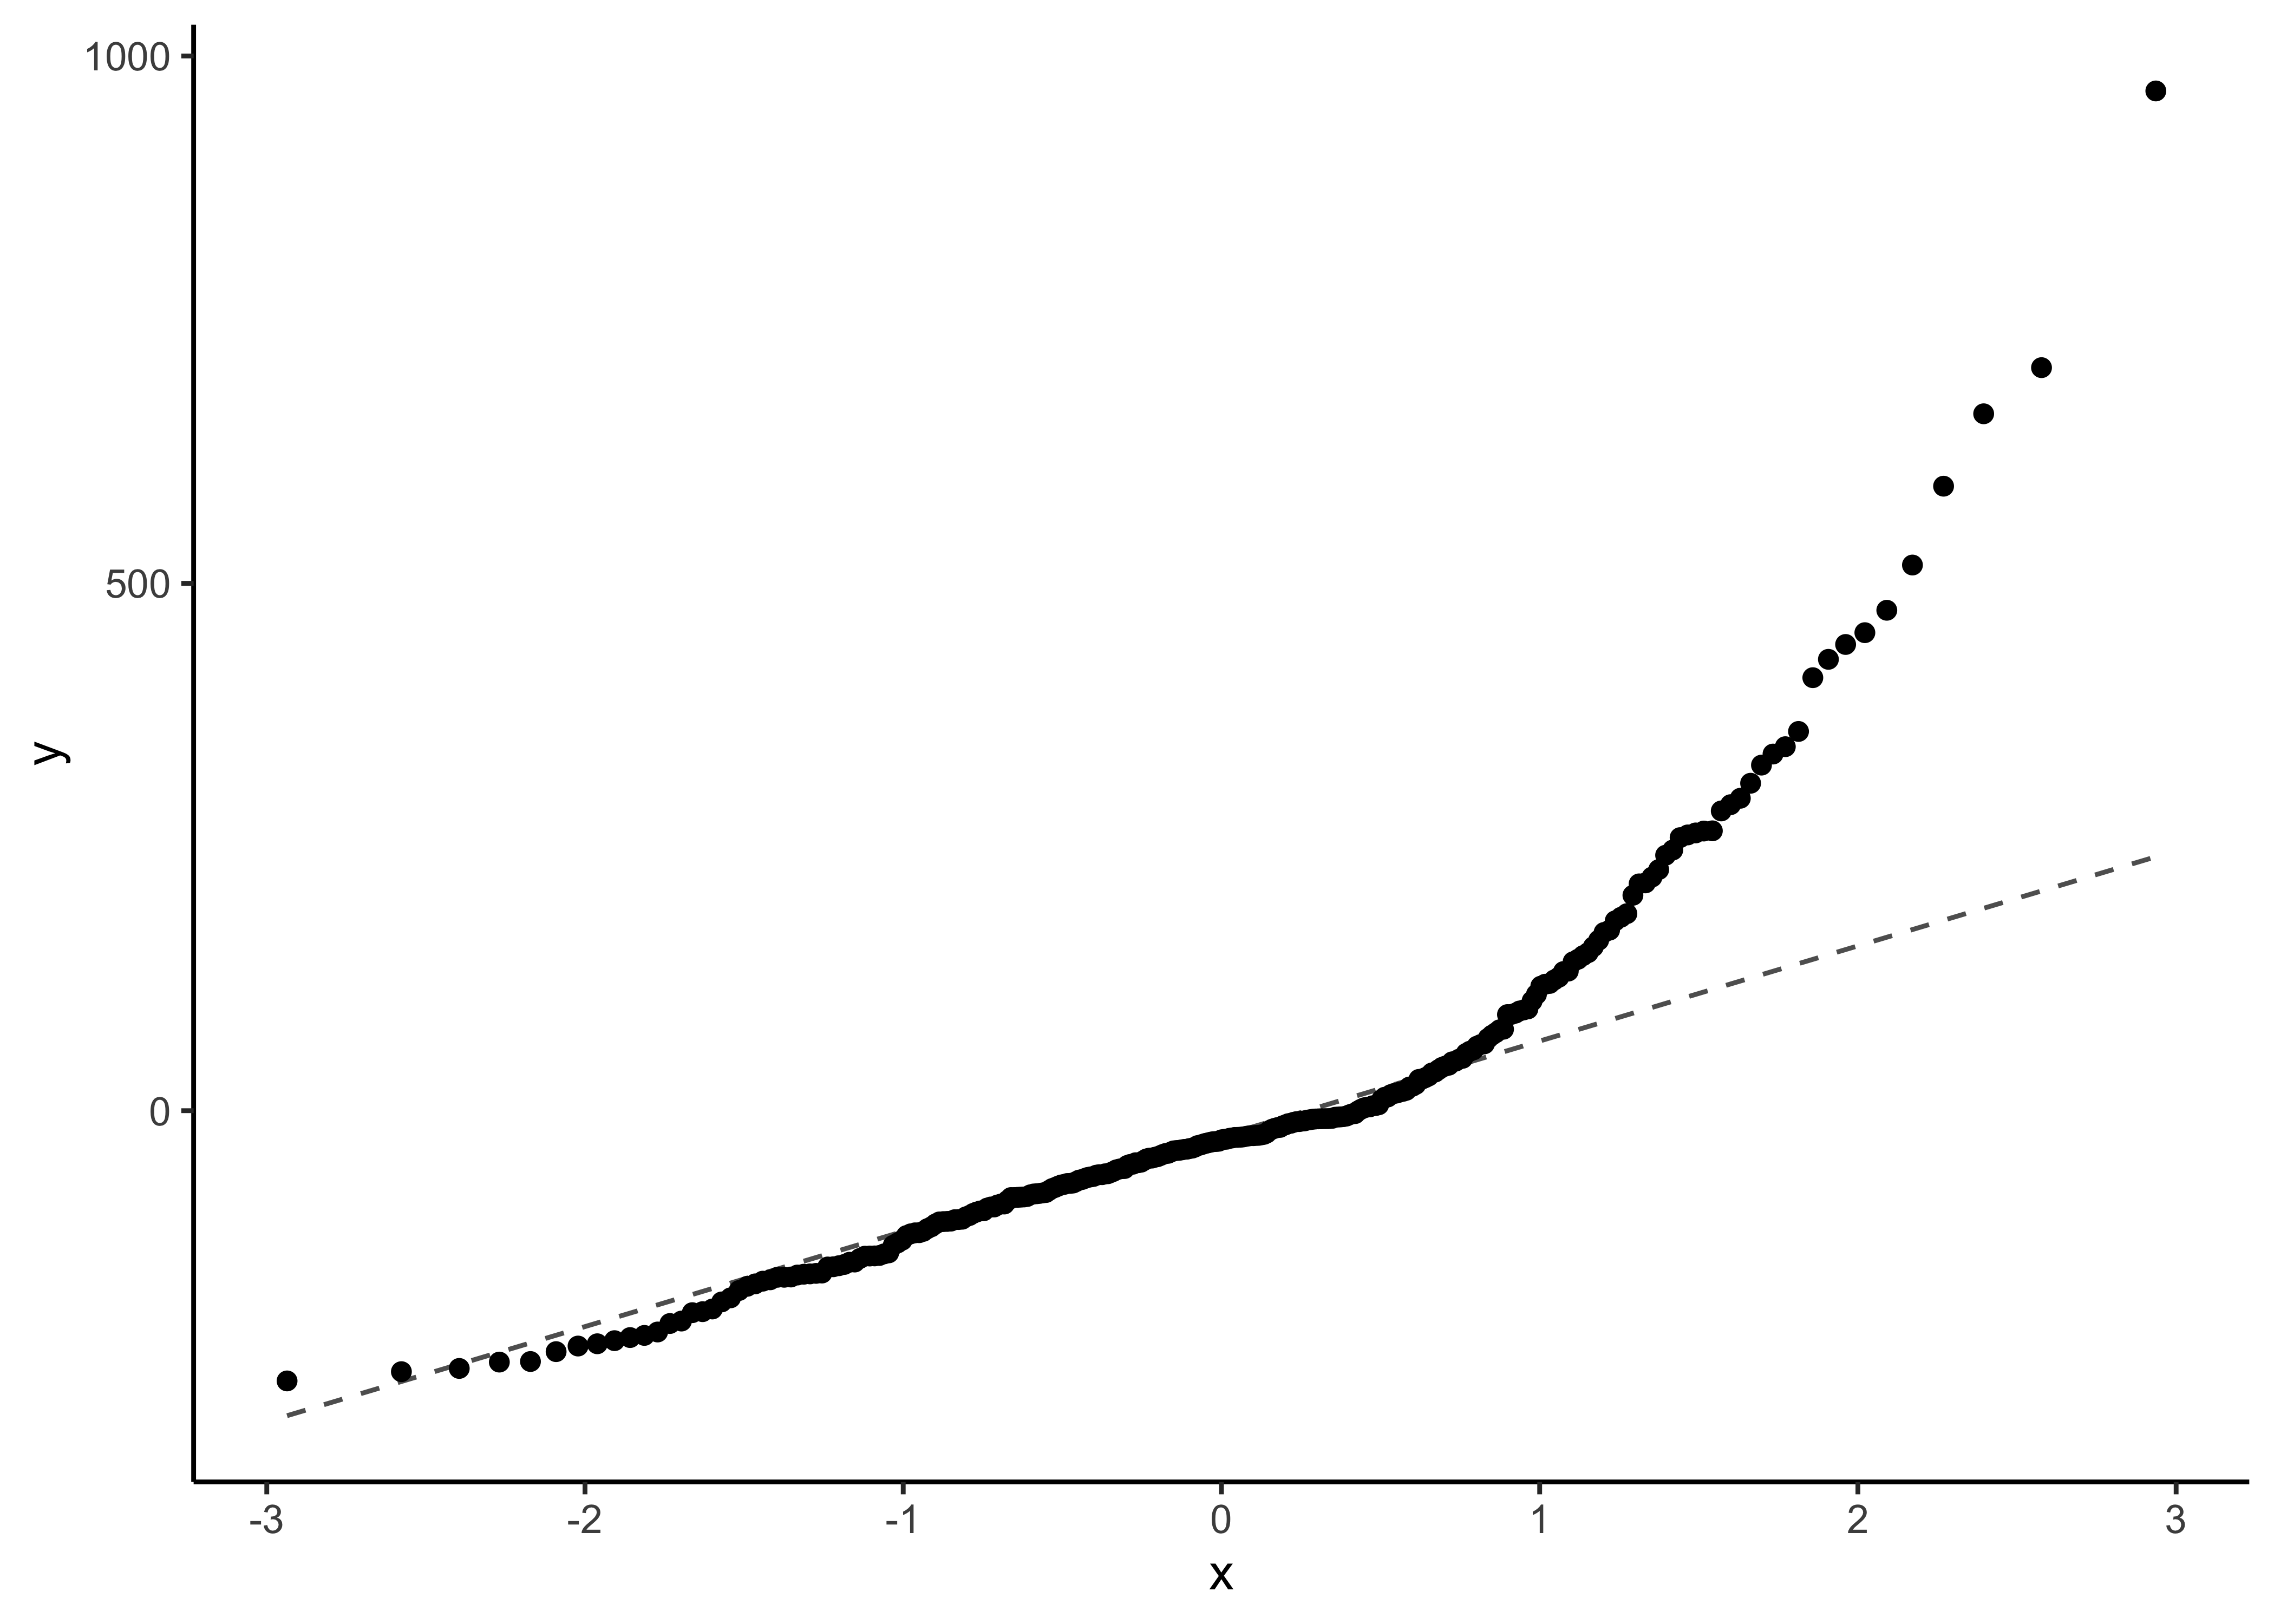
eg <- rgamma(n = 301, shape = 1, rate = 1 / x)
yn <- x + 10 + en
yu <- x + 10 + eu
yb <- x + 10 + eb
yg <- x + 10 + eg
data <- tibble(x, yn, yu, yb, yg)
datax <int> | yn <dbl> | yu <dbl> | yb <dbl> | yg <dbl> |
|---|---|---|---|---|
| 0 | 7.496430 | 8.639245 | 12 | 10.00000 |
| 1 | 12.561495 | 2.192567 | 30 | 11.76559 |
| 2 | 16.235447 | 2.567936 | 13 | 13.58764 |
| 3 | 4.098073 | 21.782213 | 15 | 15.74643 |
| 4 | 9.527473 | 12.403828 | 18 | 17.80034 |
| 5 | 15.769124 | 12.176289 | 26 | 22.22576 |
| 6 | 19.913854 | 12.971213 | 30 | 19.61077 |
| 7 | 12.033571 | 8.704312 | 19 | 17.77735 |
| 8 | 21.603782 | 11.689667 | 18 | 26.96920 |
| 9 | 20.422105 | 20.747138 | 23 | 23.20453 |