knitr::opts_chunk$set(echo = TRUE, warning = TRUE)
library(tidyverse)
library(palmerpenguins)
library(kableExtra)Lab-02: Pronouns and Data
Abstract
Part of my R Workshop using the idea of metaphors in written language.
Goals
- Understand different kinds of data variables
- Appreciate how they can be identified based on the Interrogative Pronouns they answer to
- Understand how each kind of variable lends itself to a specific geometric aspect in the data visualization.
- Understand how ask Questions of Data to develop Visualizations
Pedagogical Note
The method followed will be based on PRIMM:
- PREDICT Inspect the code and guess at what the code might do, write predictions
- RUN the code provided and check what happens
-
INFER what the
parametersof the code do and write comments to explain. What bells and whistles can you see? -
MODIFY the
parameterscode provided to understand theoptionsavailable. Write comments to show what you have aimed for and achieved. - MAKE : take an idea/concept of your own, and graph it.
Set Up
The setup code chunk below brings into our coding session R packages that provide specific computational abilities and also datasets which we can use.
To reiterate: Packages and datasets are not the same thing !! Packages are (small) collections of programs. Datasets are just….information.
Packages needed
Introduction
In this Quarto document, we try to connect story-making questions with two ideas:
- a Variable in a dataset
- A computed Quantity / Descriptive Statistic or a Visual, based on one or more Variables
So: a question identifies a variable and a question also leads to a Computation or a Data Visualization. The idea is to get the intuition behind data, and iteratively ask the questions and form hypotheses and perform Exploratory Data Analysis (EDA) using graphs and charts in R.
At some point we may find that the data is not adequate to prove/disprove a particular hypothesis and need to get into further research / experimental design. It is possible to design the research experiments also in R, but we may cover that much later.
In the following:
When it is YOUR TURN: wherever you see YOUR TURN, please respond with explanations, more questions and if you are already confident, code chunks to create new calculations and graphs. This will be one of your submissions for this module, on Teams!
Interrogative Pronouns for Data Variables
So how do we ask questions? These are usually with interrogative pronouns in English: What? Who? Where? Which? What Kind? How? and so on.
The penguins dataset
names(penguins) # Column, i.e. Variable names[1] "species" "island" "bill_length_mm"
[4] "bill_depth_mm" "flipper_length_mm" "body_mass_g"
[7] "sex" "year" head(penguins) # first six rowsspecies <fct> | island <fct> | bill_length_mm <dbl> | bill_depth_mm <dbl> | flipper_length_mm <int> | body_mass_g <int> | sex <fct> | year <int> |
|---|---|---|---|---|---|---|---|
| Adelie | Torgersen | 39.1 | 18.7 | 181 | 3750 | male | 2007 |
| Adelie | Torgersen | 39.5 | 17.4 | 186 | 3800 | female | 2007 |
| Adelie | Torgersen | 40.3 | 18.0 | 195 | 3250 | female | 2007 |
| Adelie | Torgersen | NA | NA | NA | NA | NA | 2007 |
| Adelie | Torgersen | 36.7 | 19.3 | 193 | 3450 | female | 2007 |
| Adelie | Torgersen | 39.3 | 20.6 | 190 | 3650 | male | 2007 |
tail(penguins) # Last six rowsspecies <fct> | island <fct> | bill_length_mm <dbl> | bill_depth_mm <dbl> | flipper_length_mm <int> | body_mass_g <int> | sex <fct> | year <int> |
|---|---|---|---|---|---|---|---|
| Chinstrap | Dream | 45.7 | 17.0 | 195 | 3650 | female | 2009 |
| Chinstrap | Dream | 55.8 | 19.8 | 207 | 4000 | male | 2009 |
| Chinstrap | Dream | 43.5 | 18.1 | 202 | 3400 | female | 2009 |
| Chinstrap | Dream | 49.6 | 18.2 | 193 | 3775 | male | 2009 |
| Chinstrap | Dream | 50.8 | 19.0 | 210 | 4100 | male | 2009 |
| Chinstrap | Dream | 50.2 | 18.7 | 198 | 3775 | female | 2009 |
dim(penguins) # Size of dataset[1] 344 8[1] TRUE
Inspect the Data
- What are the variable
names()? - What would be the Question you might have asked to obtain each of the variables?
- What further questions/meta questions would you ask to “process” that variable? ( Hint: Add another word after any of the Interrogative Pronouns, e.g. How…MANY?)
- Where might the answers take your story?
Your Turn #1
State a few questions after discussion with your friend and state possible variables, or what you could DO with the variables, as an answer.
E.g. Q. How many penguins? A. We need to count…rows?
Pronouns and Variables
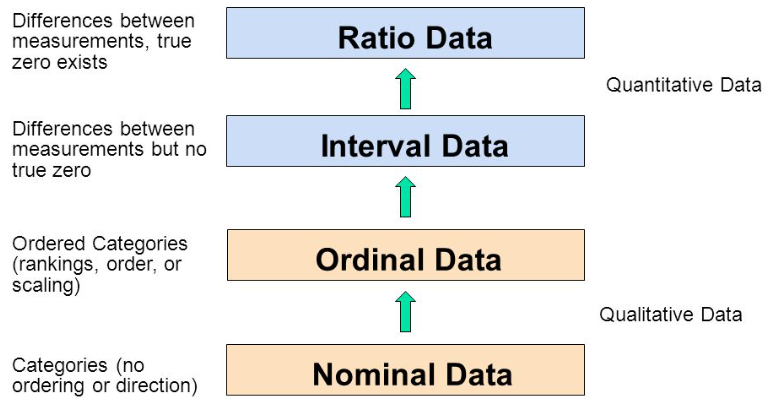
In the Table below, we have a rough mapping of interrogative pronouns to the kinds of variables in the data:
| No | Pronoun | Answer | Variable/Scale | Example | What Operations? |
|---|---|---|---|---|---|
| 1 | How Many / Much / Heavy? Few? Seldom? Often? When? | Quantities, with Scale and a Zero Value.Differences and Ratios /Products are meaningful. | Quantitative/Ratio | Length,Height,Temperature in Kelvin,Activity,Dose Amount,Reaction Rate,Flow Rate,Concentration,Pulse,Survival Rate | Correlation |
| 2 | How Many / Much / Heavy? Few? Seldom? Often? When? | Quantities with Scale. Differences are meaningful, but not products or ratios | Quantitative/Interval | pH,SAT score(200-800),Credit score(300-850),SAT score(200-800),Year of Starting College | Mean,Standard Deviation |
| 3 | How, What Kind, What Sort | A Manner / Method, Type or Attribute from a list, with list items in some " order" ( e.g. good, better, improved, best..) | Qualitative/Ordinal | Socioeconomic status (Low income, Middle income, High income),Education level (HighSchool, BS, MS, PhD),Satisfaction rating(Very much Dislike, Dislike, Neutral, Like, Very Much Like) | Median,Percentile |
| 4 | What, Who, Where, Whom, Which | Name, Place, Animal, Thing | Qualitative/Nominal | Name | Count no. of cases,Mode |
As you go from Qualitative to Quantitative data types in the table, I hope you can detect a movement from fuzzy groups/categories to more and more crystallized numbers. Each variable/scale can be subjected to the operations of the previous group. In the words of S.S. Stevens (https://psychology.okstate.edu/faculty/jgrice/psyc3214/Stevens_FourScales_1946.pdf)
the basic operations needed to create each type of scale is cumulative: to an operation listed opposite a particular scale must be added all those operations preceding it.
Do think about this as you work with data.
Do take a look at these references:
The mpg dataset
names(mpg) # Column, i.e. Variable names [1] "manufacturer" "model" "displ" "year" "cyl"
[6] "trans" "drv" "cty" "hwy" "fl"
[11] "class" head(mpg) # first six rowsmanufacturer <chr> | model <chr> | displ <dbl> | year <int> | cyl <int> | trans <chr> | drv <chr> | cty <int> | hwy <int> | fl <chr> | |
|---|---|---|---|---|---|---|---|---|---|---|
| audi | a4 | 1.8 | 1999 | 4 | auto(l5) | f | 18 | 29 | p | |
| audi | a4 | 1.8 | 1999 | 4 | manual(m5) | f | 21 | 29 | p | |
| audi | a4 | 2.0 | 2008 | 4 | manual(m6) | f | 20 | 31 | p | |
| audi | a4 | 2.0 | 2008 | 4 | auto(av) | f | 21 | 30 | p | |
| audi | a4 | 2.8 | 1999 | 6 | auto(l5) | f | 16 | 26 | p | |
| audi | a4 | 2.8 | 1999 | 6 | manual(m5) | f | 18 | 26 | p |
tail(mpg) # Last six rowsmanufacturer <chr> | model <chr> | displ <dbl> | year <int> | cyl <int> | trans <chr> | drv <chr> | cty <int> | hwy <int> | fl <chr> | |
|---|---|---|---|---|---|---|---|---|---|---|
| volkswagen | passat | 1.8 | 1999 | 4 | auto(l5) | f | 18 | 29 | p | |
| volkswagen | passat | 2.0 | 2008 | 4 | auto(s6) | f | 19 | 28 | p | |
| volkswagen | passat | 2.0 | 2008 | 4 | manual(m6) | f | 21 | 29 | p | |
| volkswagen | passat | 2.8 | 1999 | 6 | auto(l5) | f | 16 | 26 | p | |
| volkswagen | passat | 2.8 | 1999 | 6 | manual(m5) | f | 18 | 26 | p | |
| volkswagen | passat | 3.6 | 2008 | 6 | auto(s6) | f | 17 | 26 | p |
dim(mpg) # Size of dataset[1] 234 11[1] FALSEYOUR TURN-2
Look carefully at the variables here. How would you interpret say the cyl variable? Is it a number and therefore Quantitative, or could it be something else?
Interrogations and Graphs
We can also respond to ( more complex ) Questions, with not just a variable but one of two things:
- A calculation, shown in a table
- a data visualization. This visualization can even involve more than one variable, as we will see.
What sort of calculations, and visuals charts can we create with different kinds of variables, taken singly or together? Let us write some simple English descriptions of measures and visuals and see what commands they use in R.
Here we will use the Grammar of a package called ggplot, which we will encounter in Lab:04. Let us go with our intuition with the code in the following sections.
Note: since we saw a couple of missing entries in the penguins dataset, let us remove them for now.
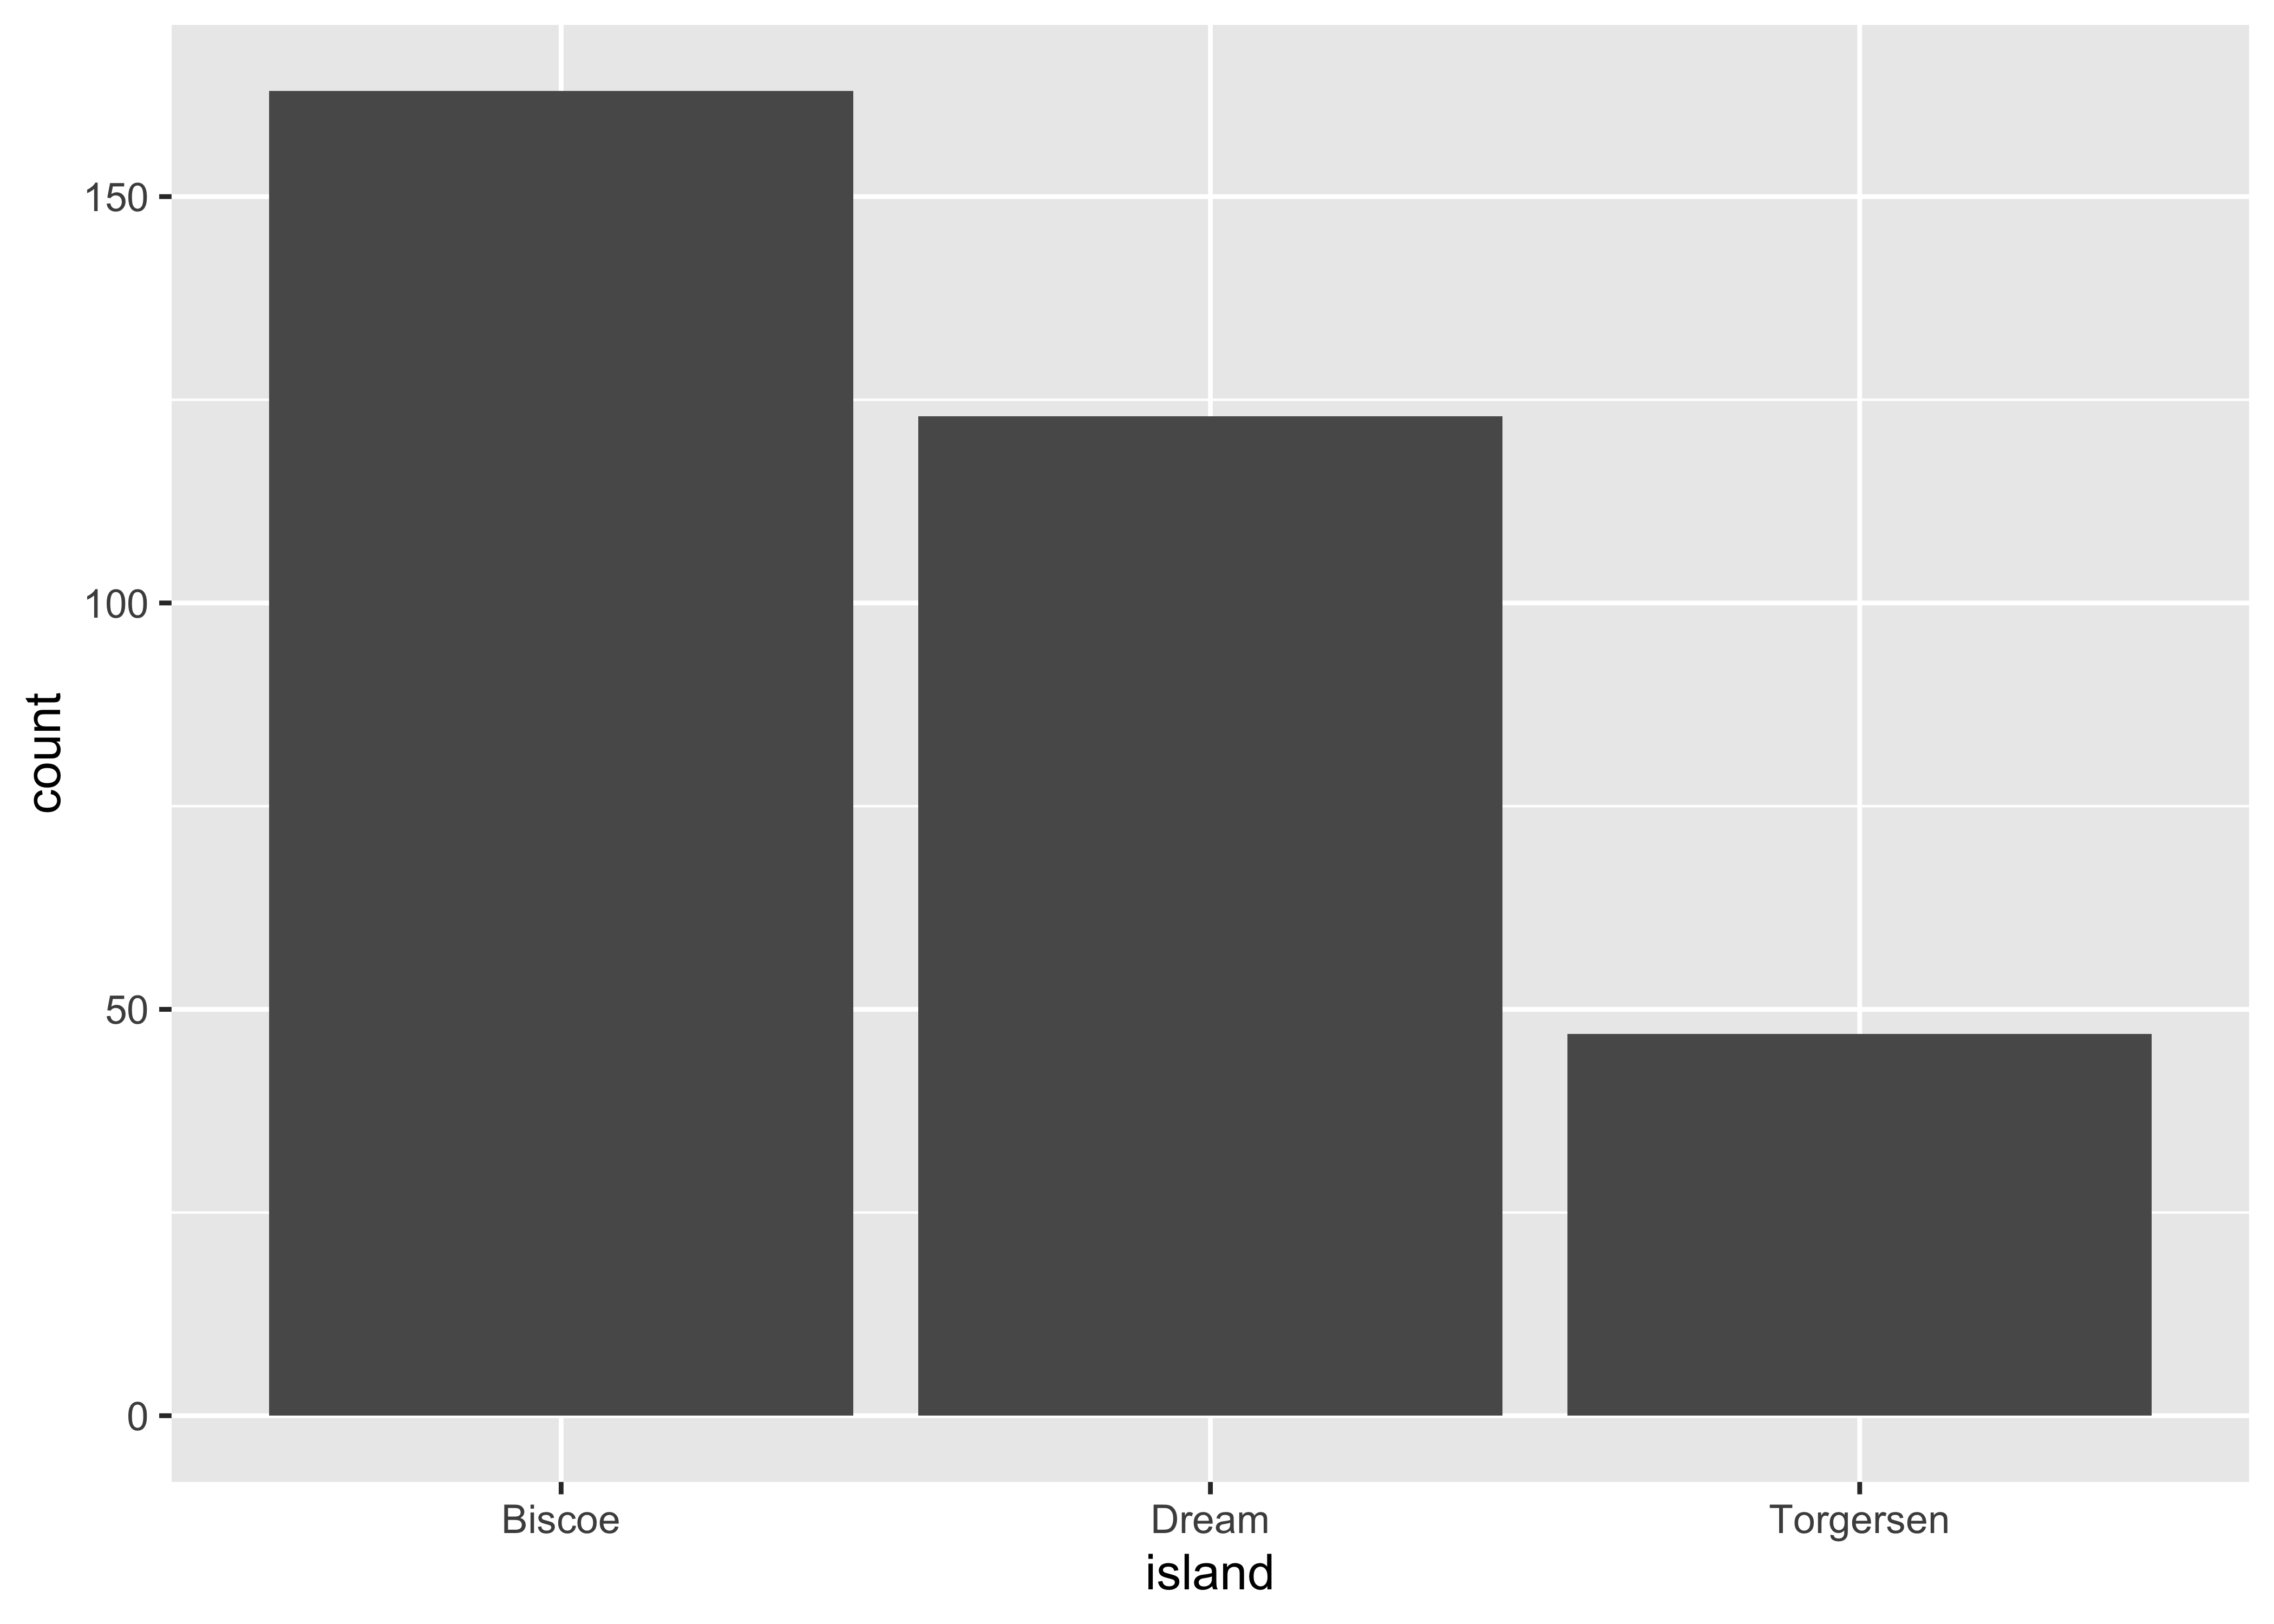
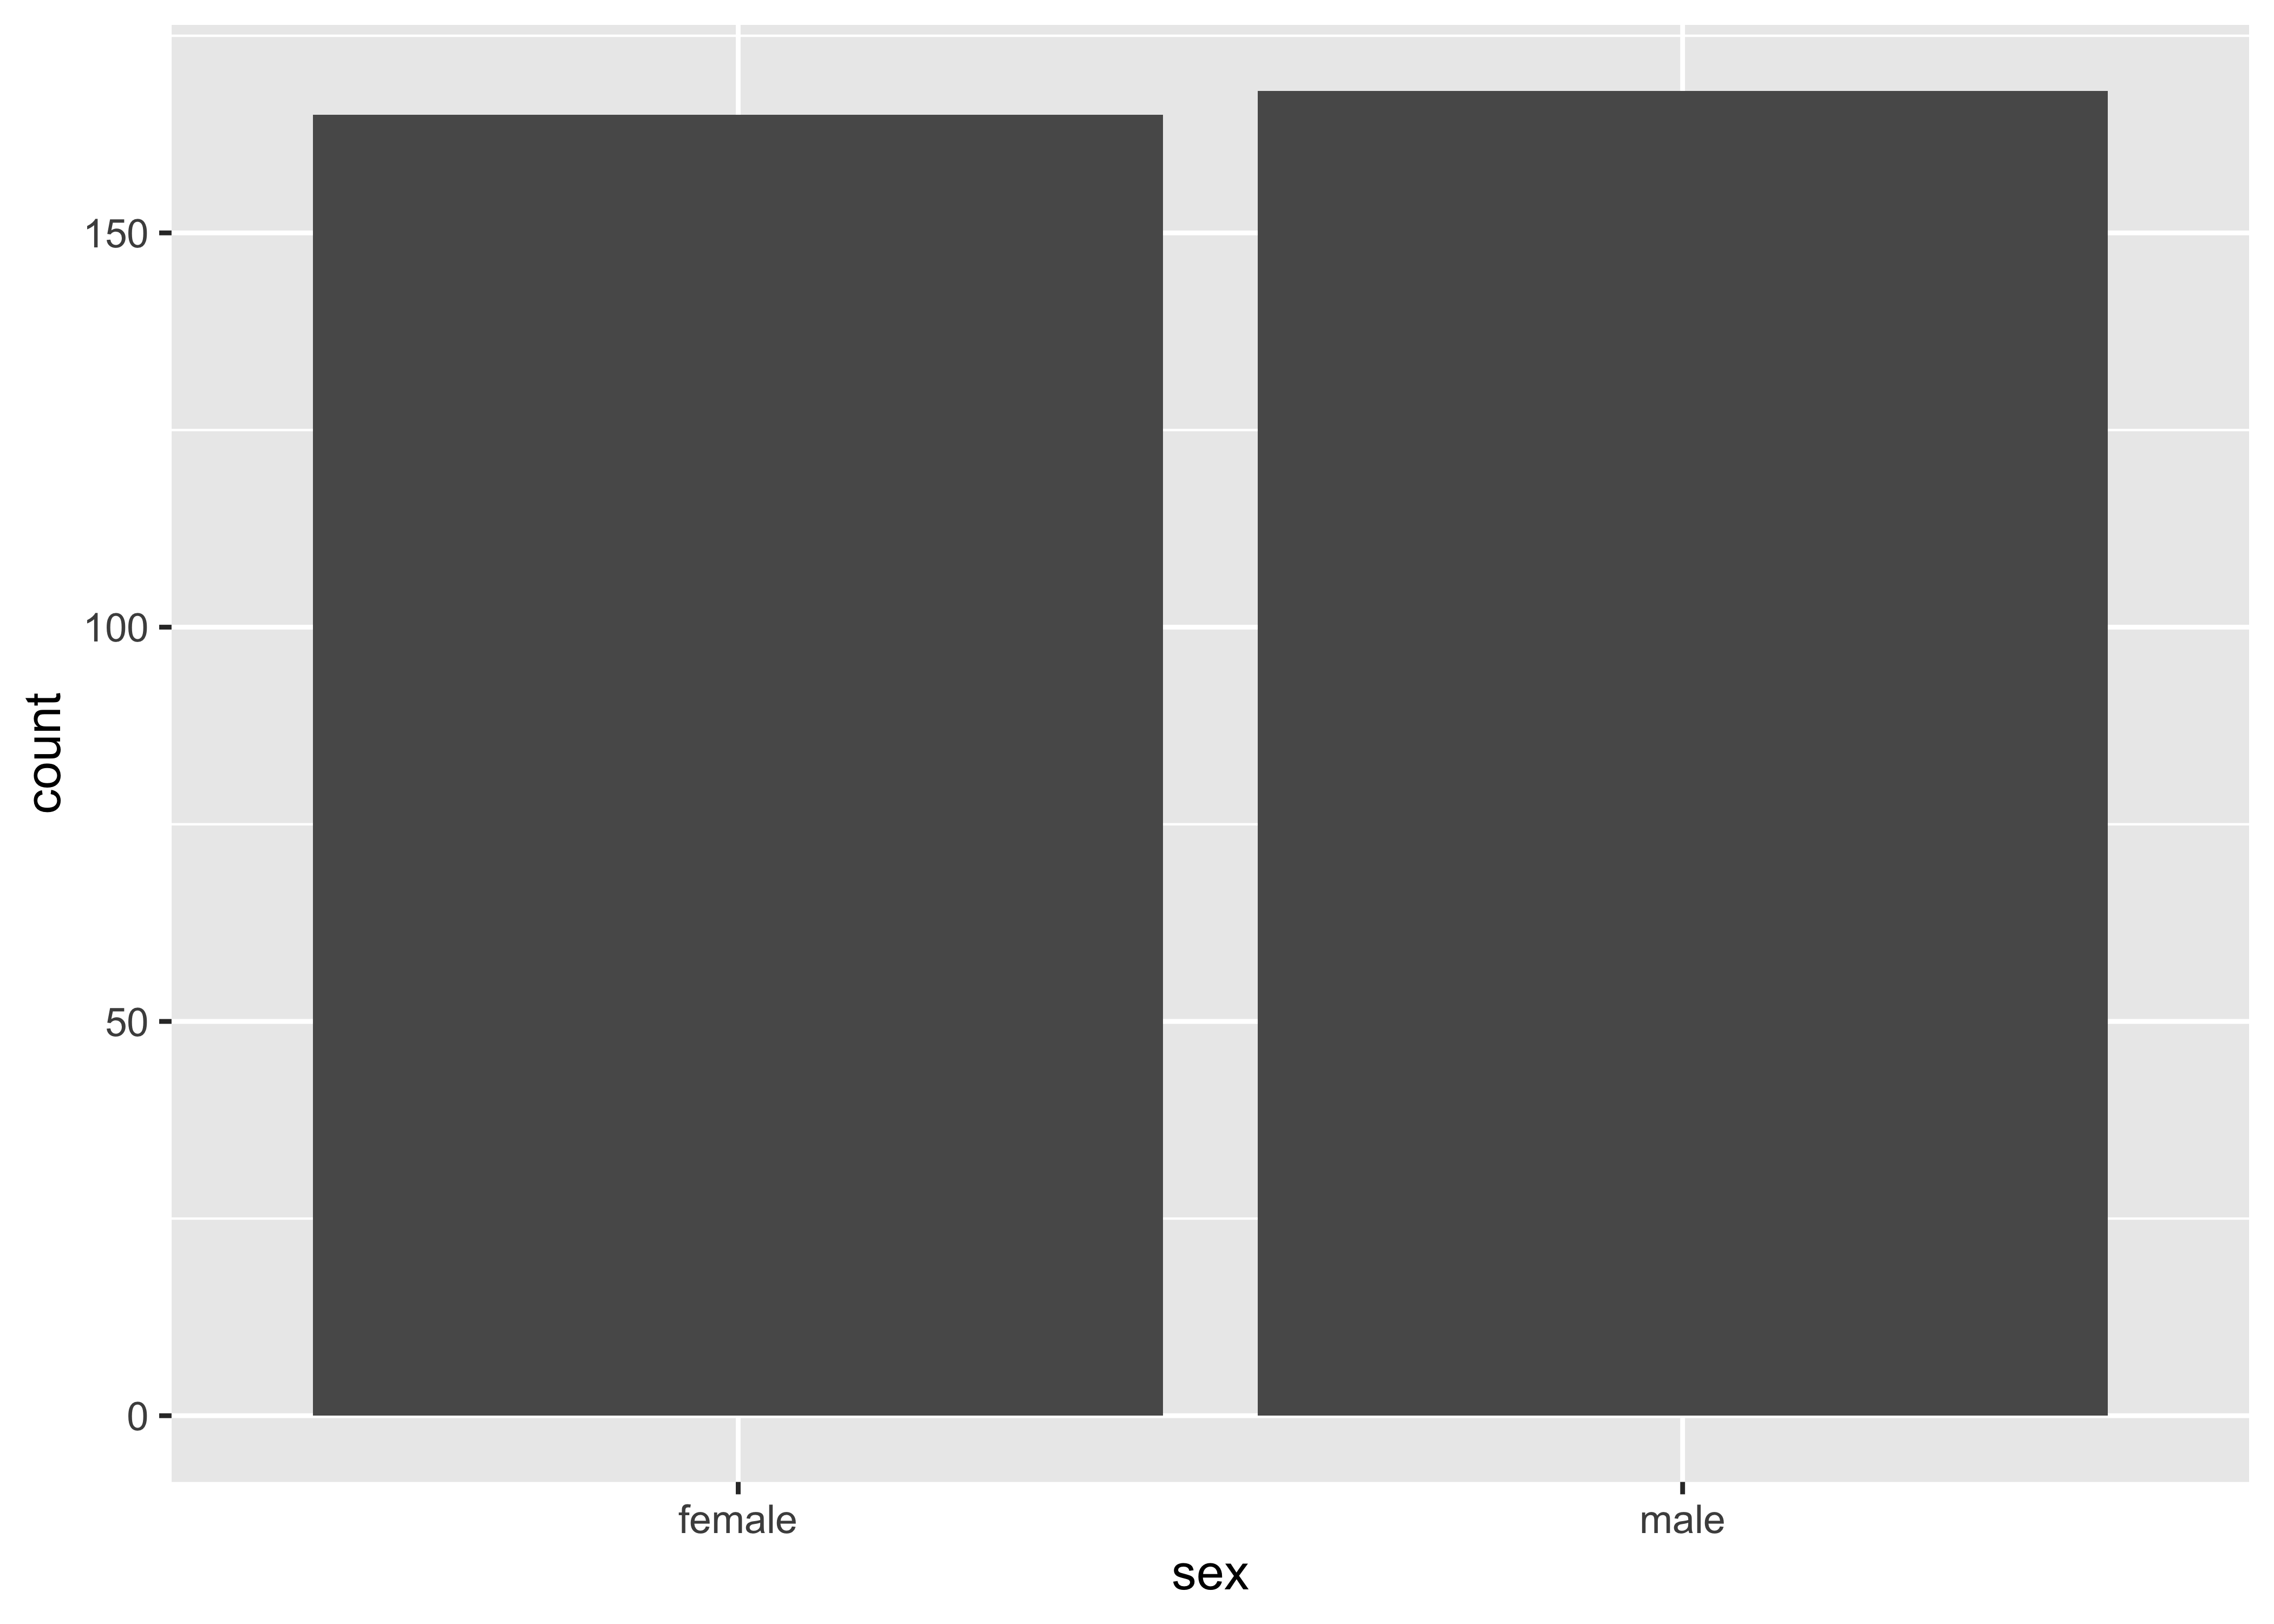
Single Qualitative/Categorical/ Nominal Variable
- Questions: Which? What Kind? How? How many of each Kind?
- Island ( Which island ? )
- Species ( Which Species? )
- Calculations: No of
levels/ Counts for eachlevel
-
count / tallyof no. of penguins on each island or in each species -
sortandorderby island or species
- Charts: Bar Chart / Pie Chart / Tree Map
-
geom_bar/geom_bar + coord_polar()/ Find out!!
YOUR TURN-3
Single Quantitative Variable
Questions: How many? How few? How often? How much?
Calculations: max / min / mean / mode / (units)
- Charts: Bar Chart / Histogram / Density
max(penguins$bill_length_mm)[1] 59.6range(penguins$bill_length_mm, na.rm = TRUE)[1] 32.1 59.6summary(penguins$flipper_length_mm) Min. 1st Qu. Median Mean 3rd Qu. Max.
172 190 197 201 213 231 ggplot(penguins) +
geom_density(aes(bill_length_mm))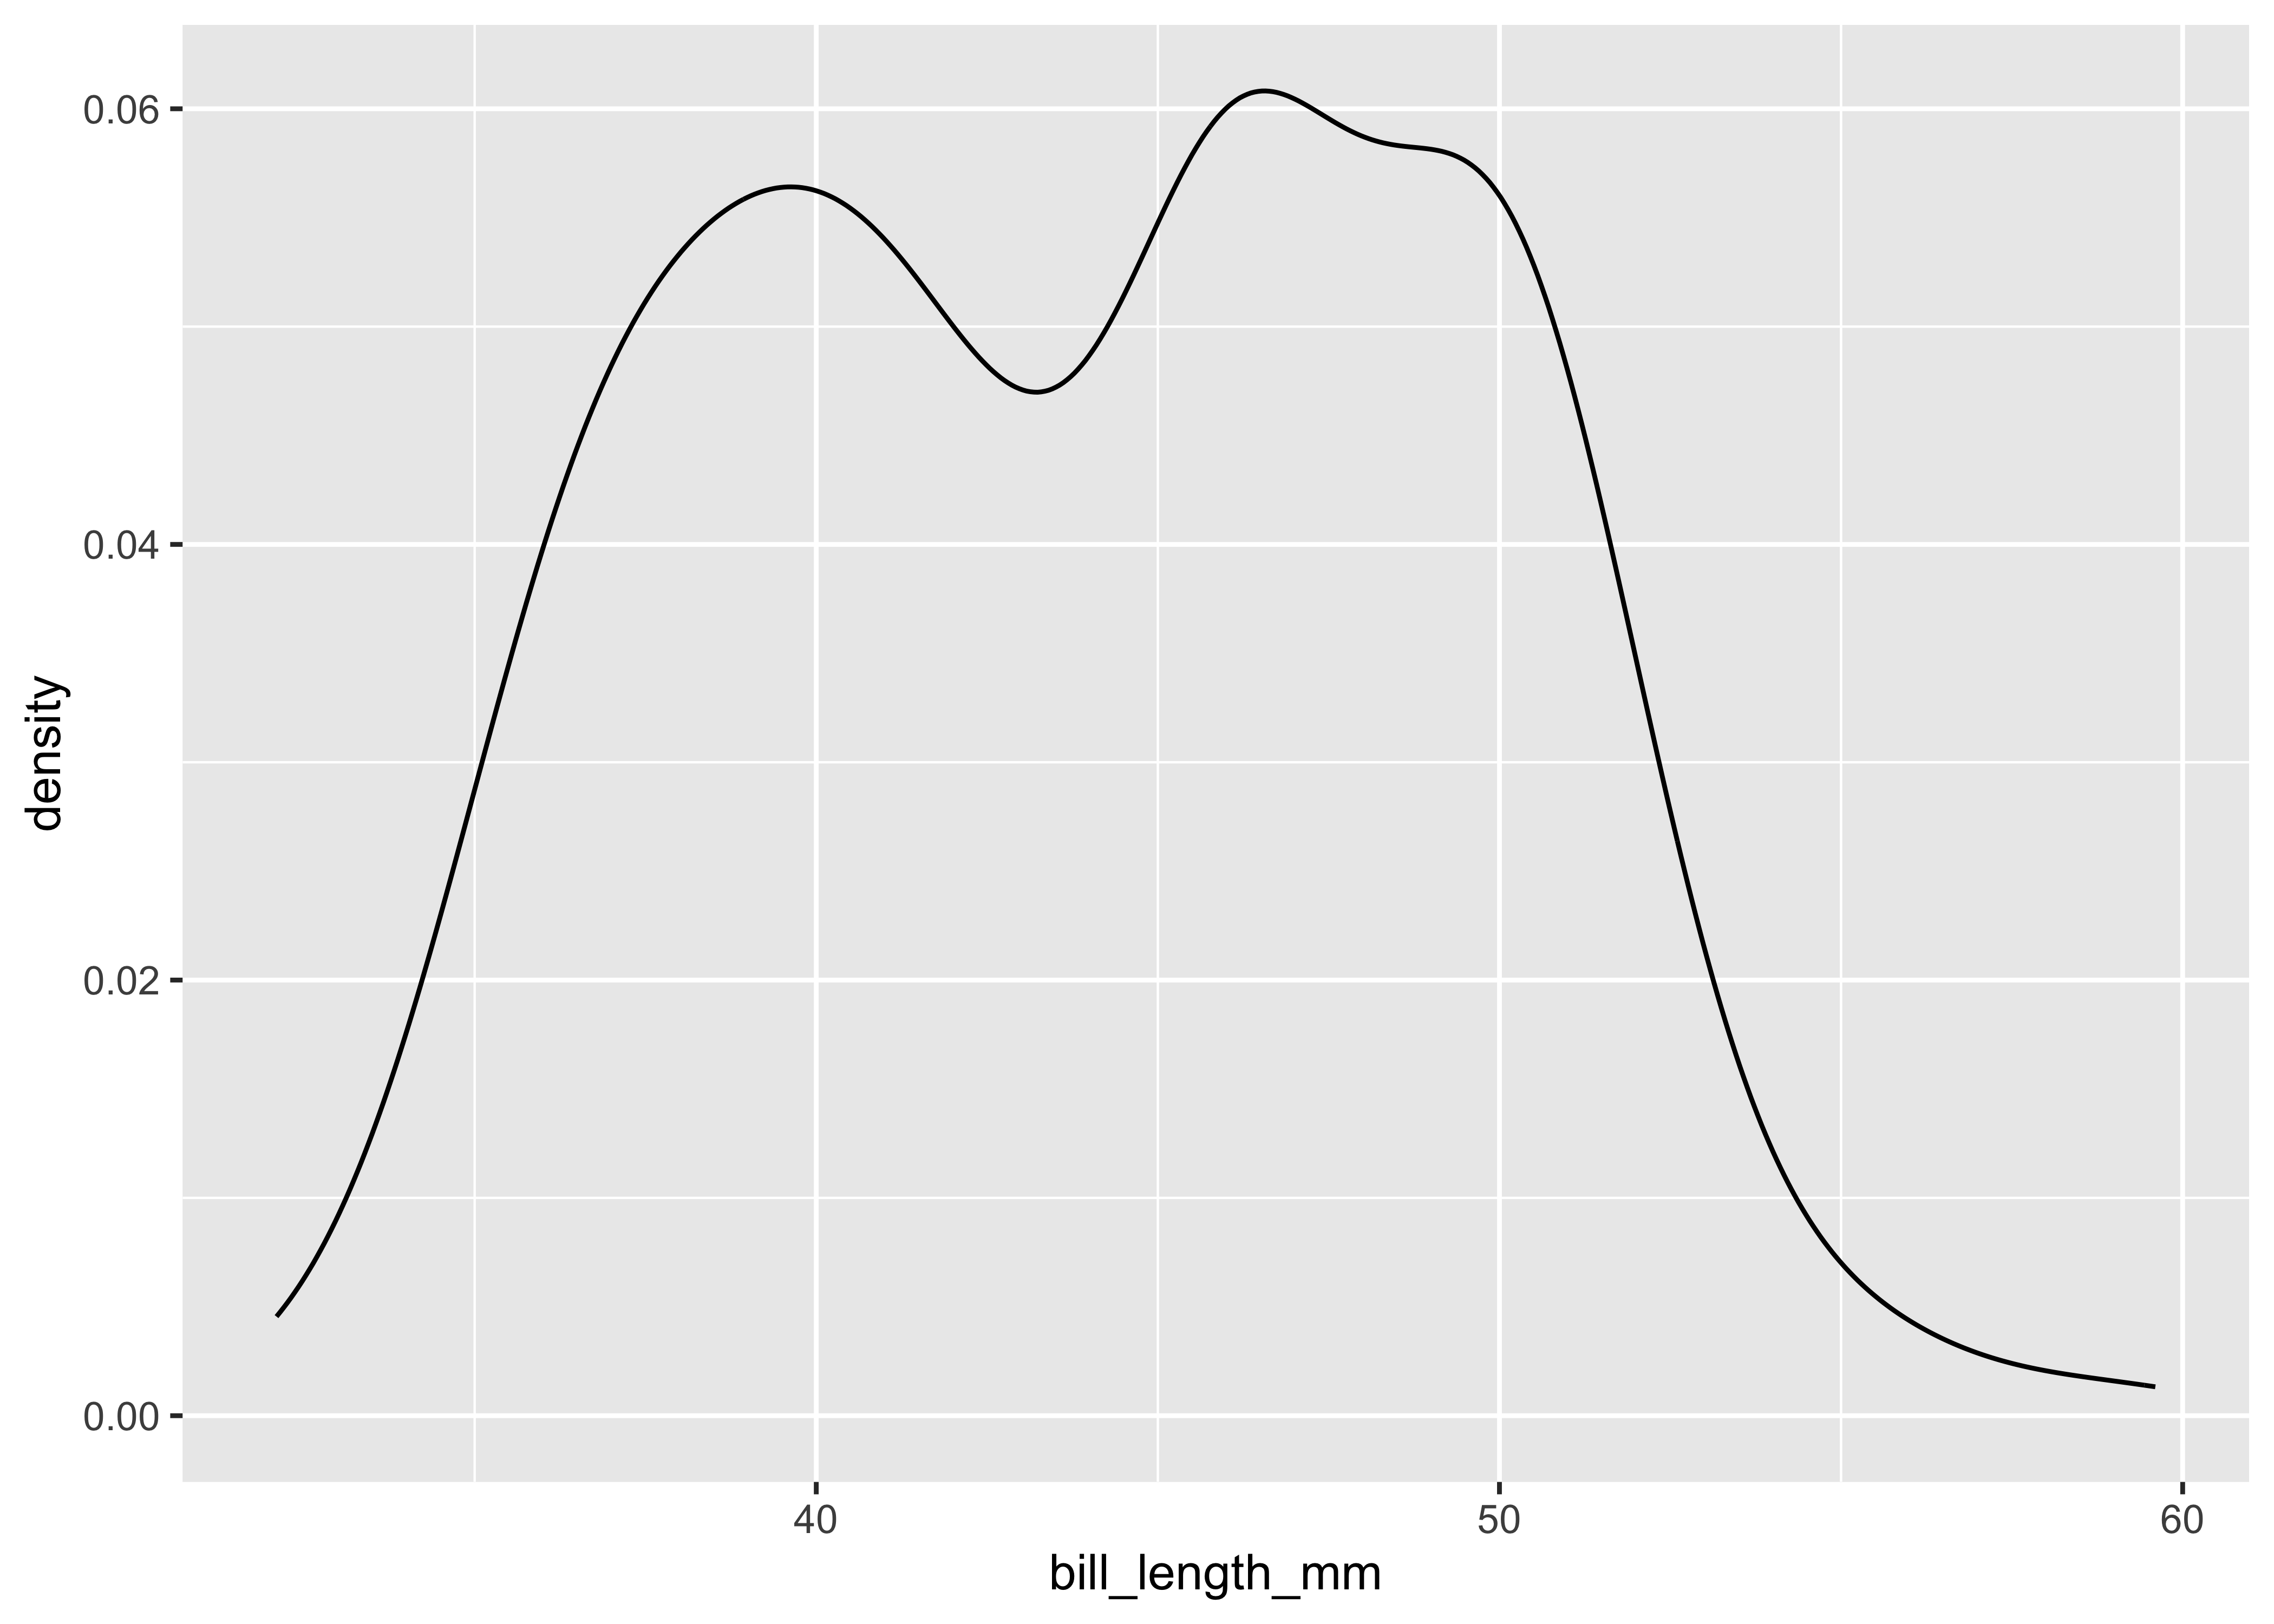
ggplot(penguins) +
  geom_histogram(aes(x = bill_length_mm))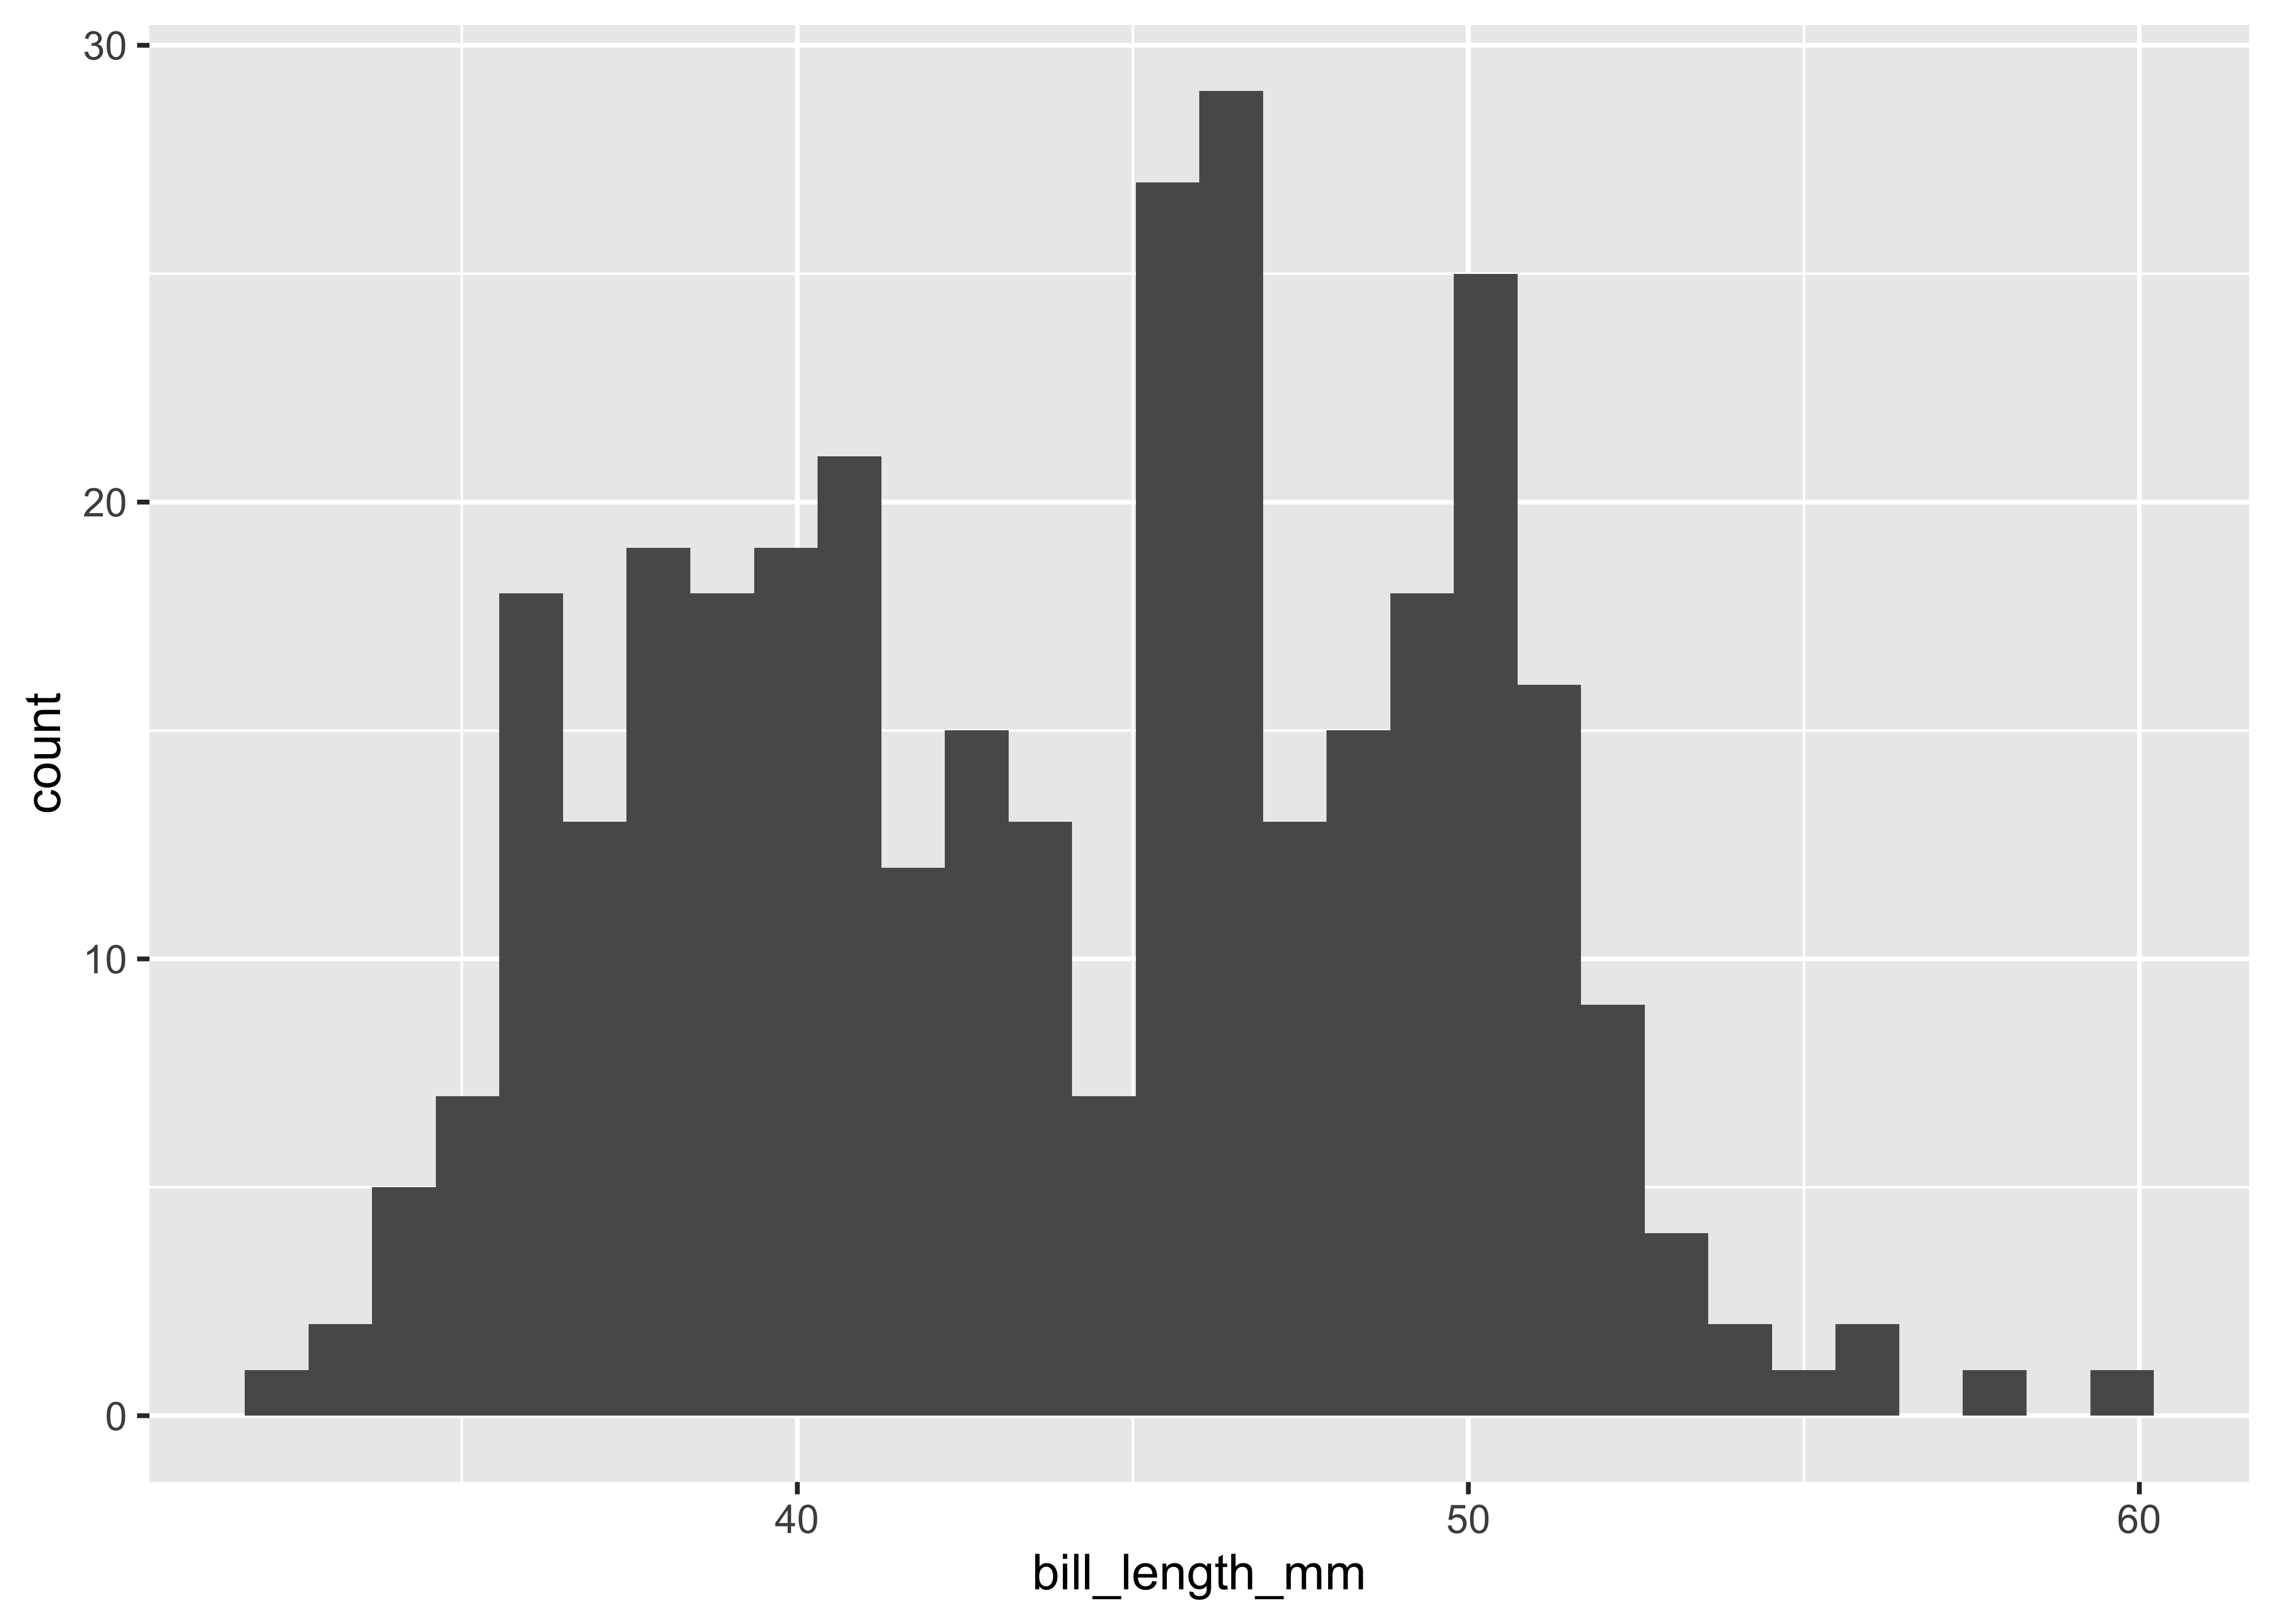
YOUR TURN-4
Are all the above Quantitative variables ratio variables? Justify.
Two Variables: Quantitative vs Quantitative
We can easily extend our intuition about one quantitative variable, to a pair of them. What Questions can we ask?
Questions: How many of this vs How many of that? Does this depend upon that? How are they related? (Remember
Calculations: Correlation / Covariance / T-test / Chi-Square Test for Two Means etc. We won’t go into this here !
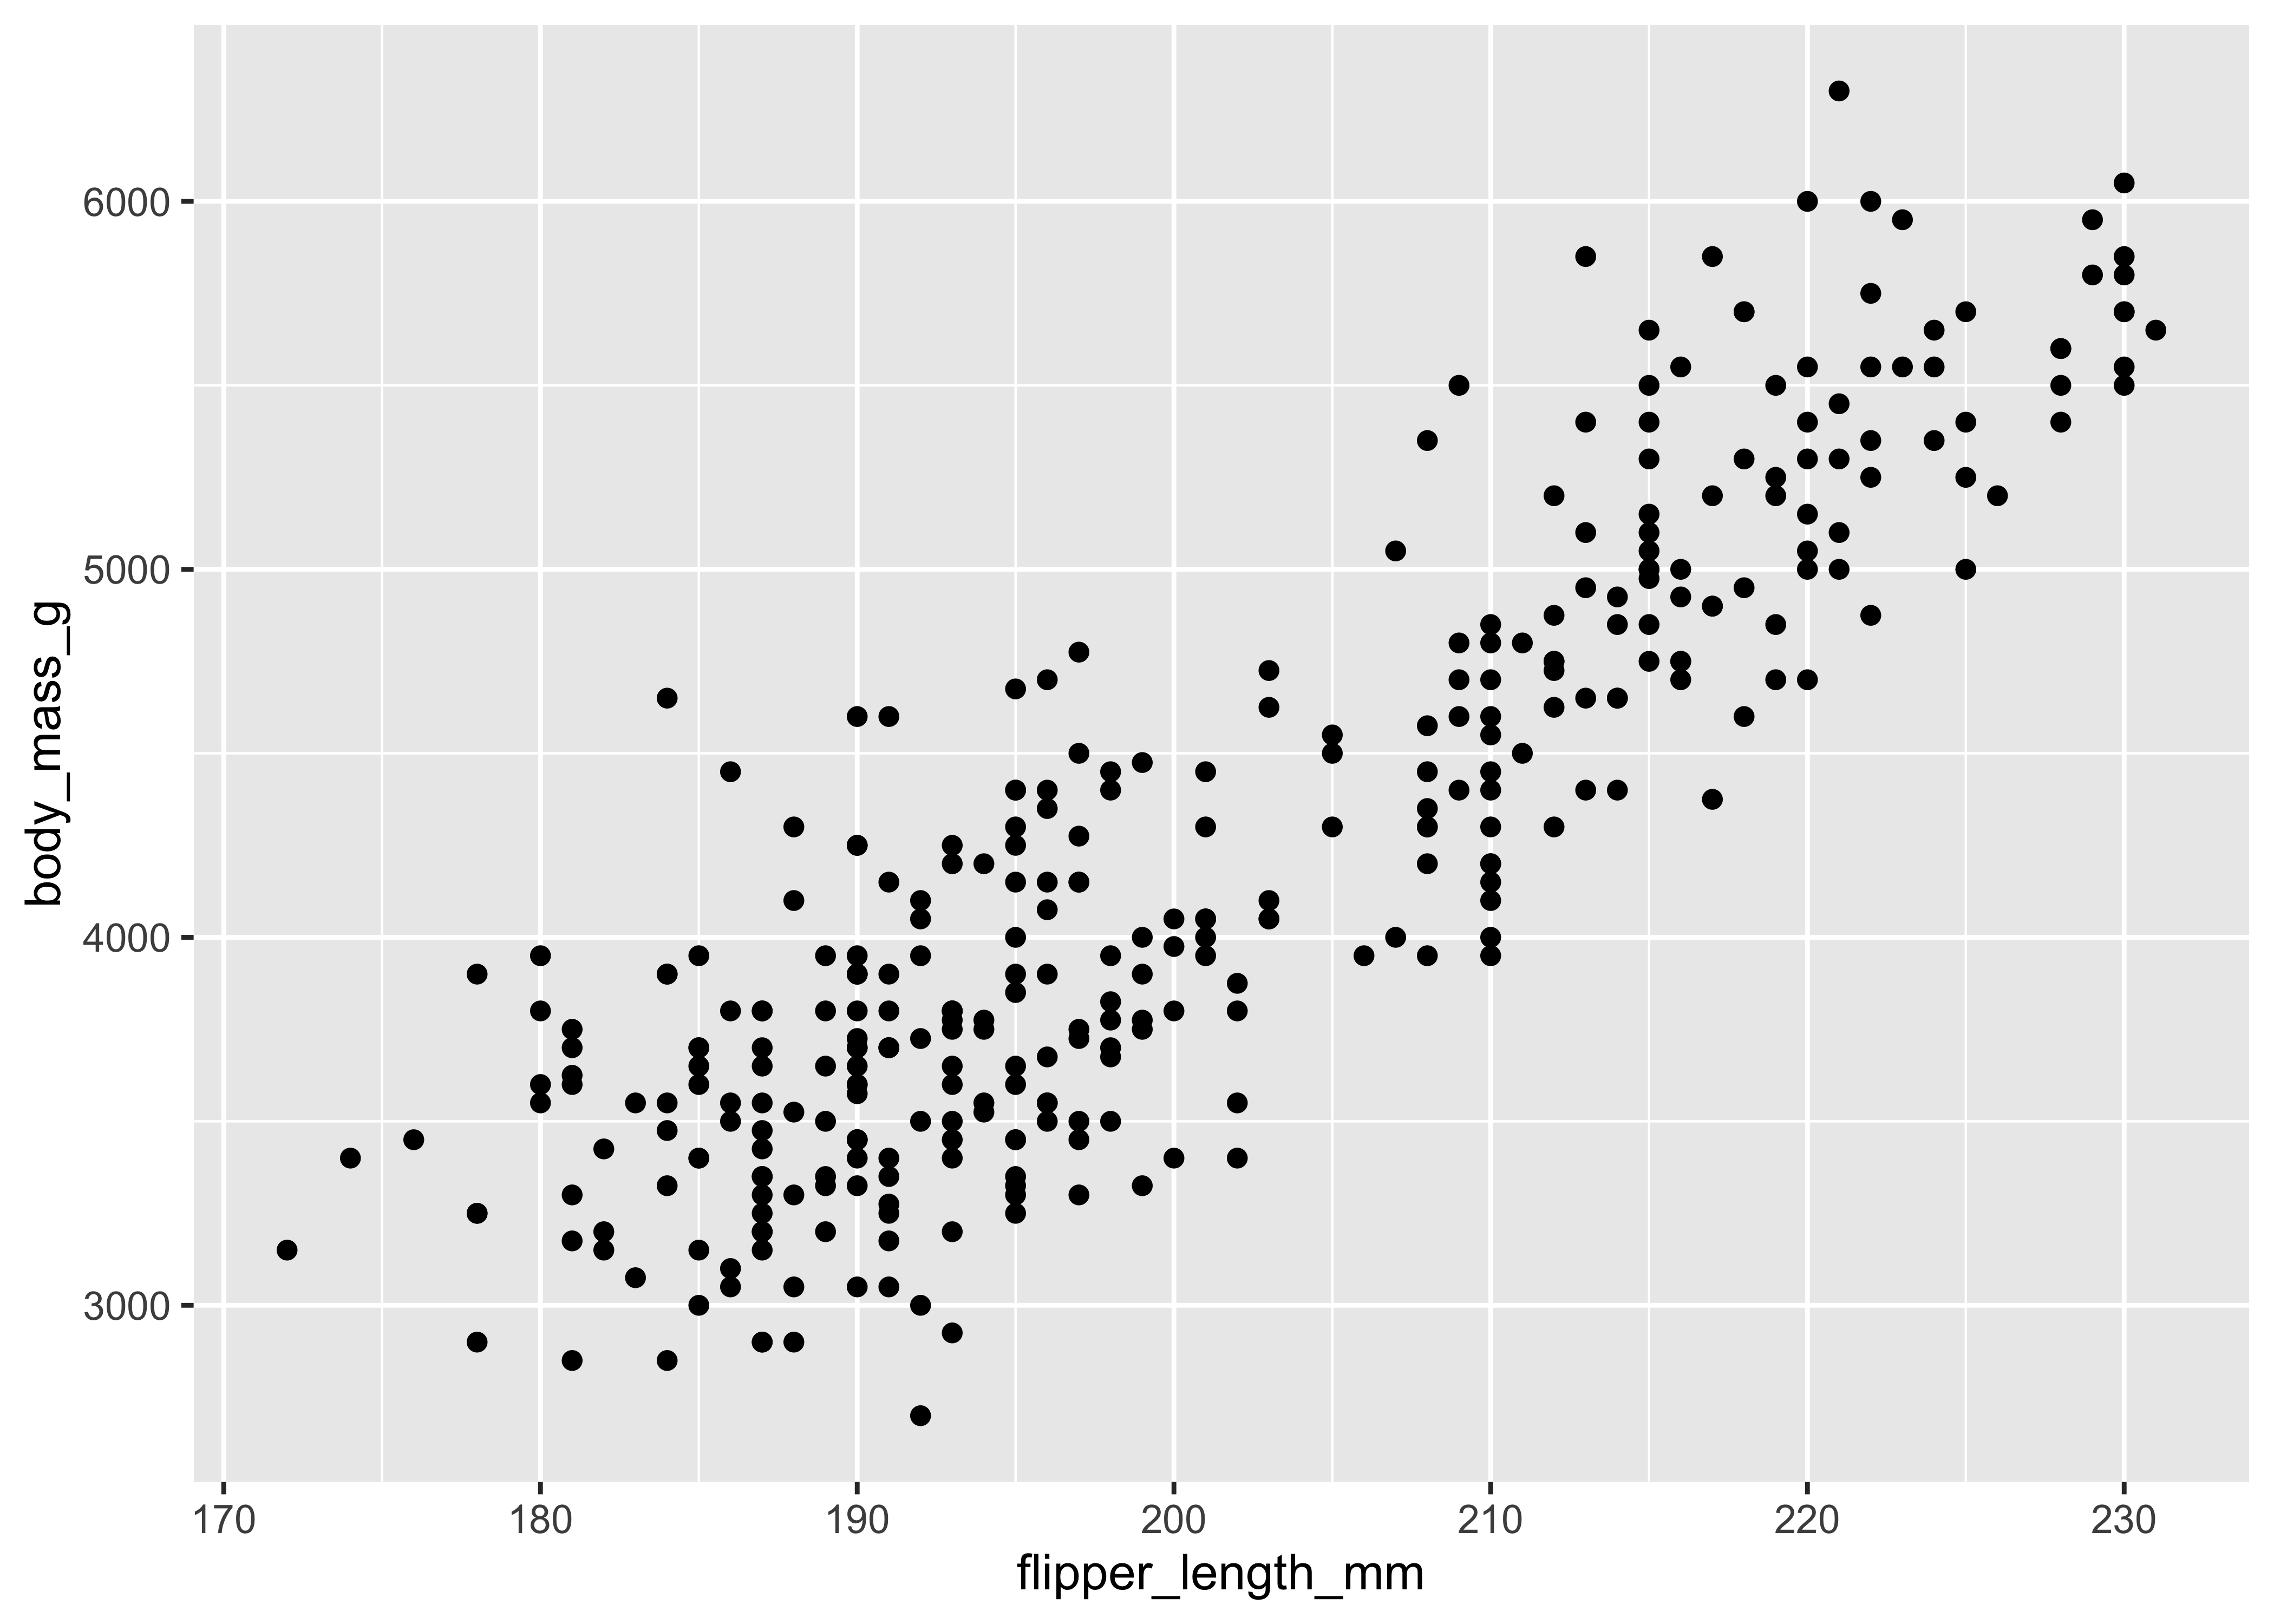
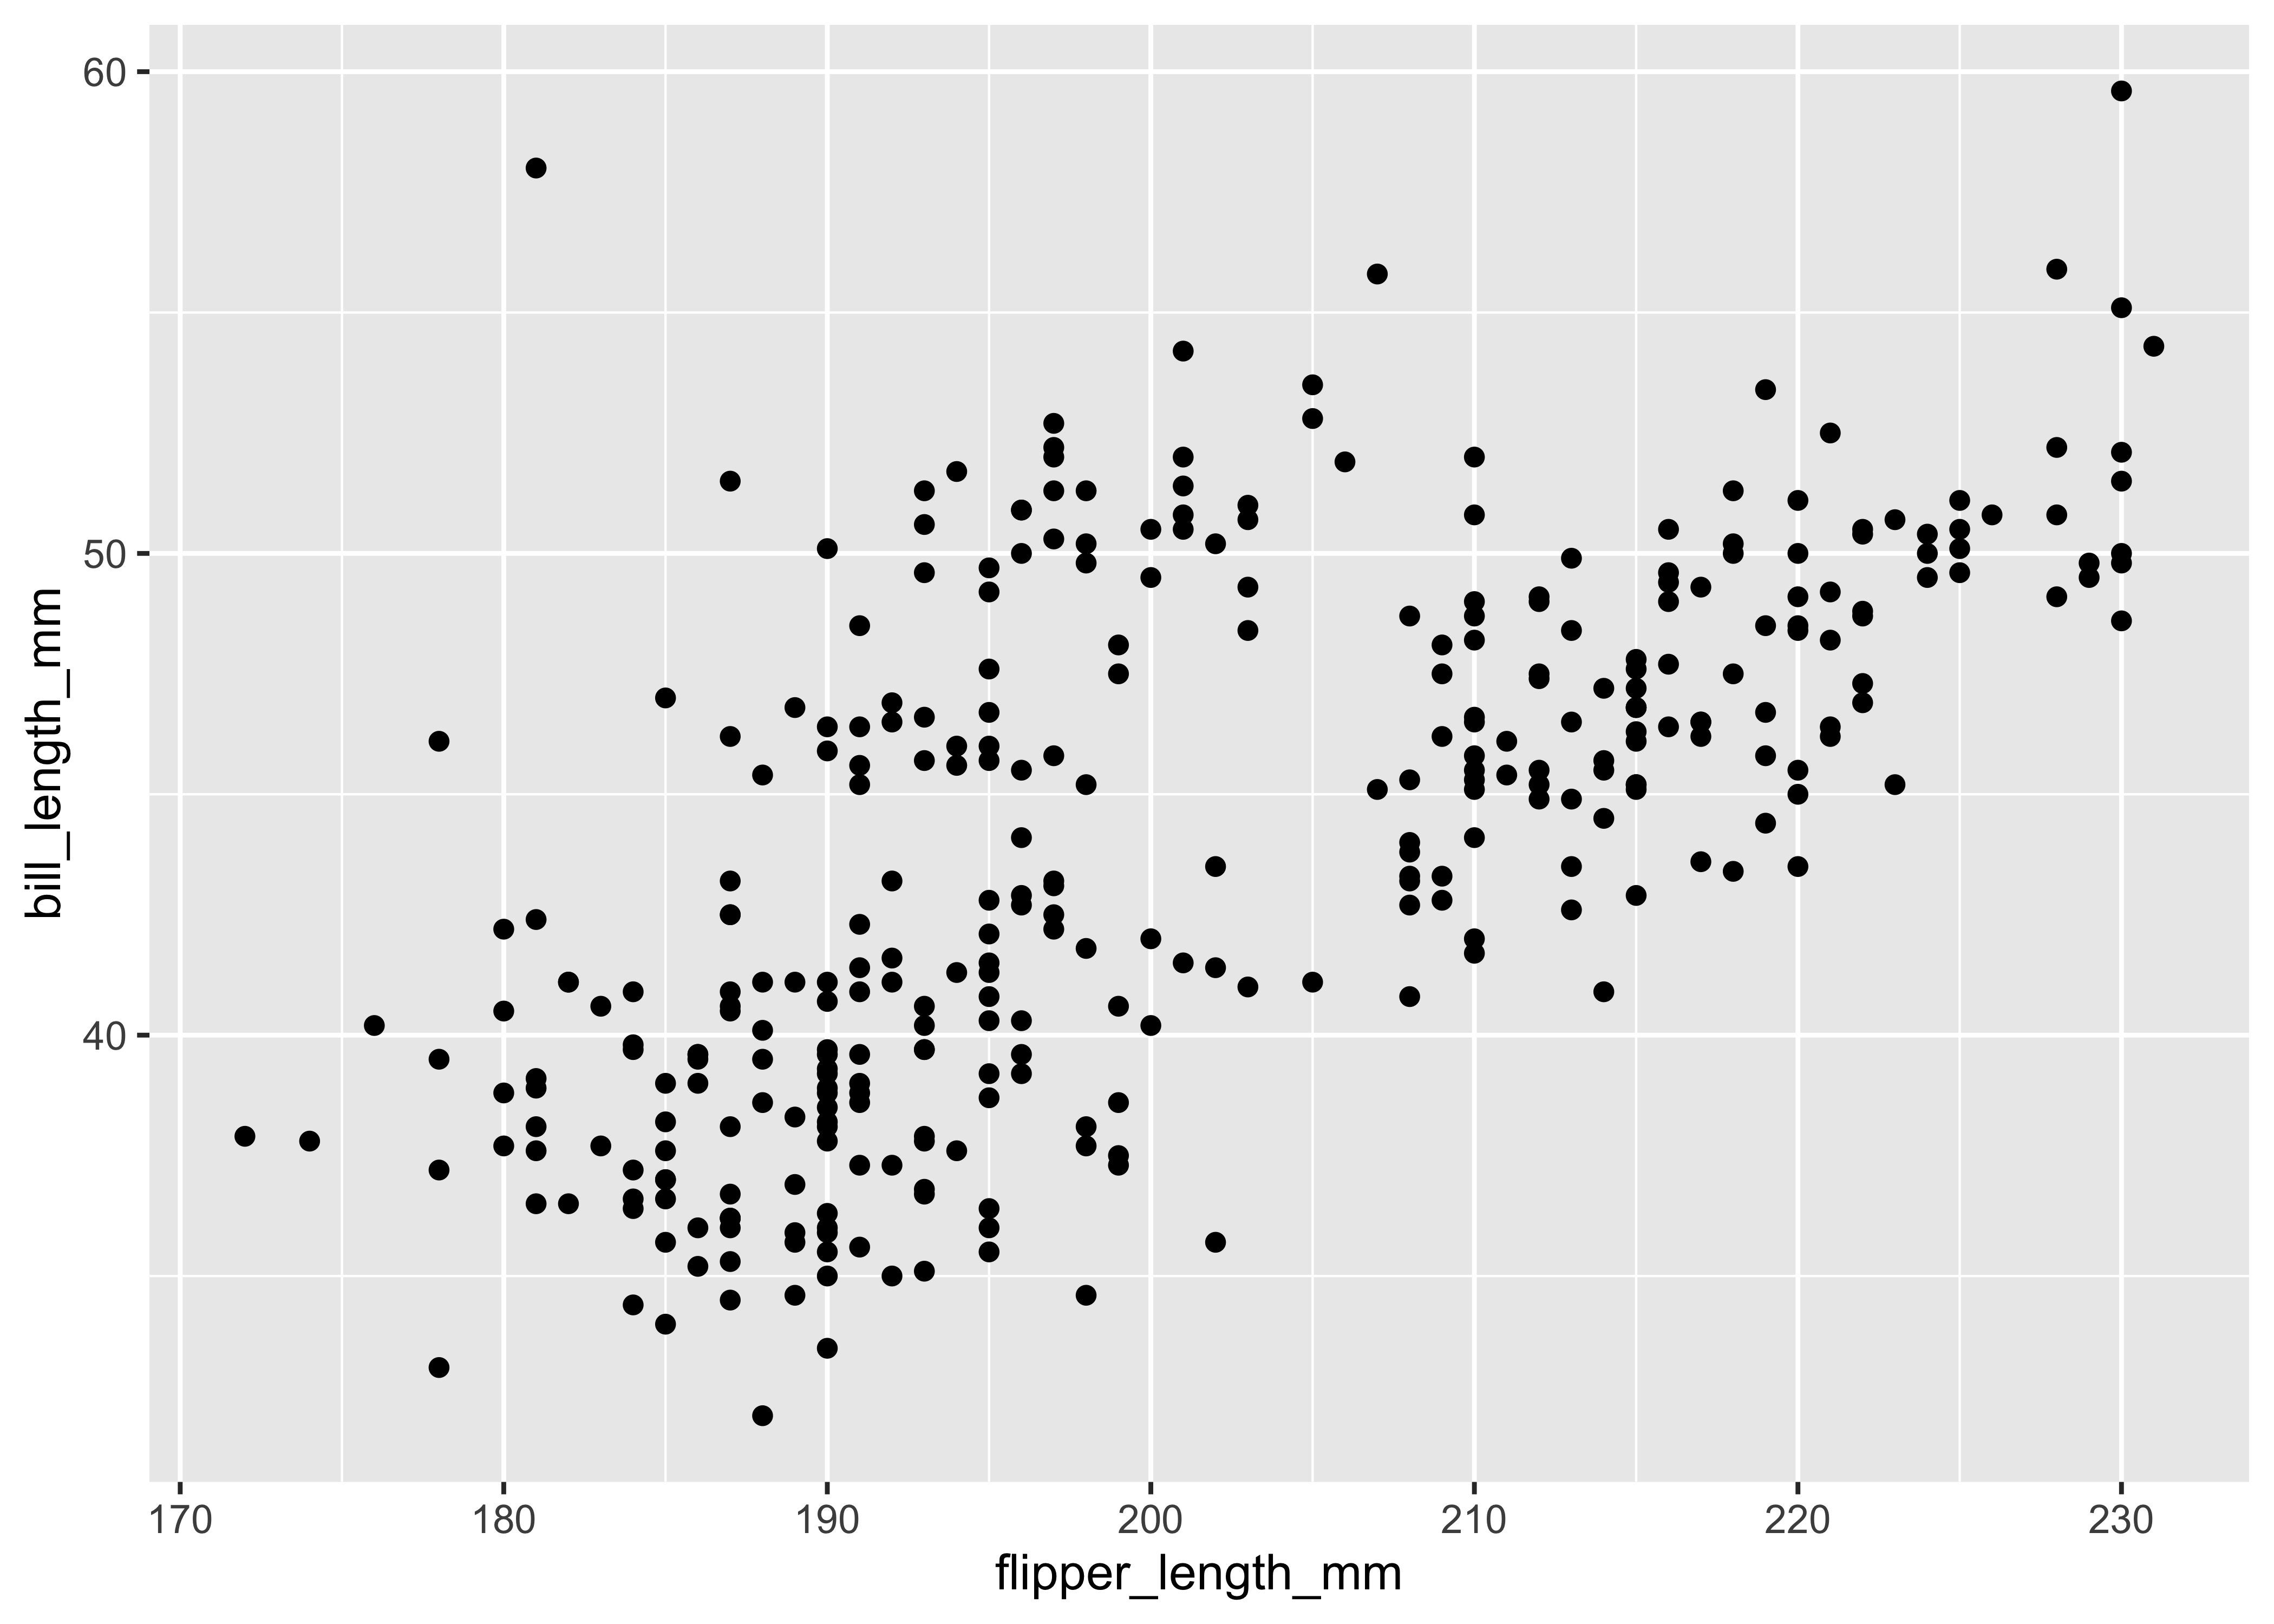
Charts: Scatter Plot / Line Plot / Regression i.e. best fit lines
cor(penguins$bill_length_mm, penguins$bill_depth_mm)[1] -0.2286256ggplot(penguins) +
geom_point(aes(
x = flipper_length_mm,
y = body_mass_g
))
ggplot(penguins) +
  geom_point(aes(
    x = flipper_length_mm,
    y = bill_length_mm
  ))
YOUR TURN-5
Two Variables: Categorical vs Categorical
What sort of question could we ask that involves two categorical variables?
Questions: How Many of this Kind( ~x) are How Many of that Kind( ~y ) ?
-
Calculations: Counts and Tallies sliced by Category
-
counts,tally
-
-
Charts: Stacked Bar Charts / Grouped Bar Charts / Segmented Bar Chart / Mosaic Chart
geom_bar()- Use the second Categorical variables to modify
fill,color. - Also try to vary the parameter
positionof the bars.
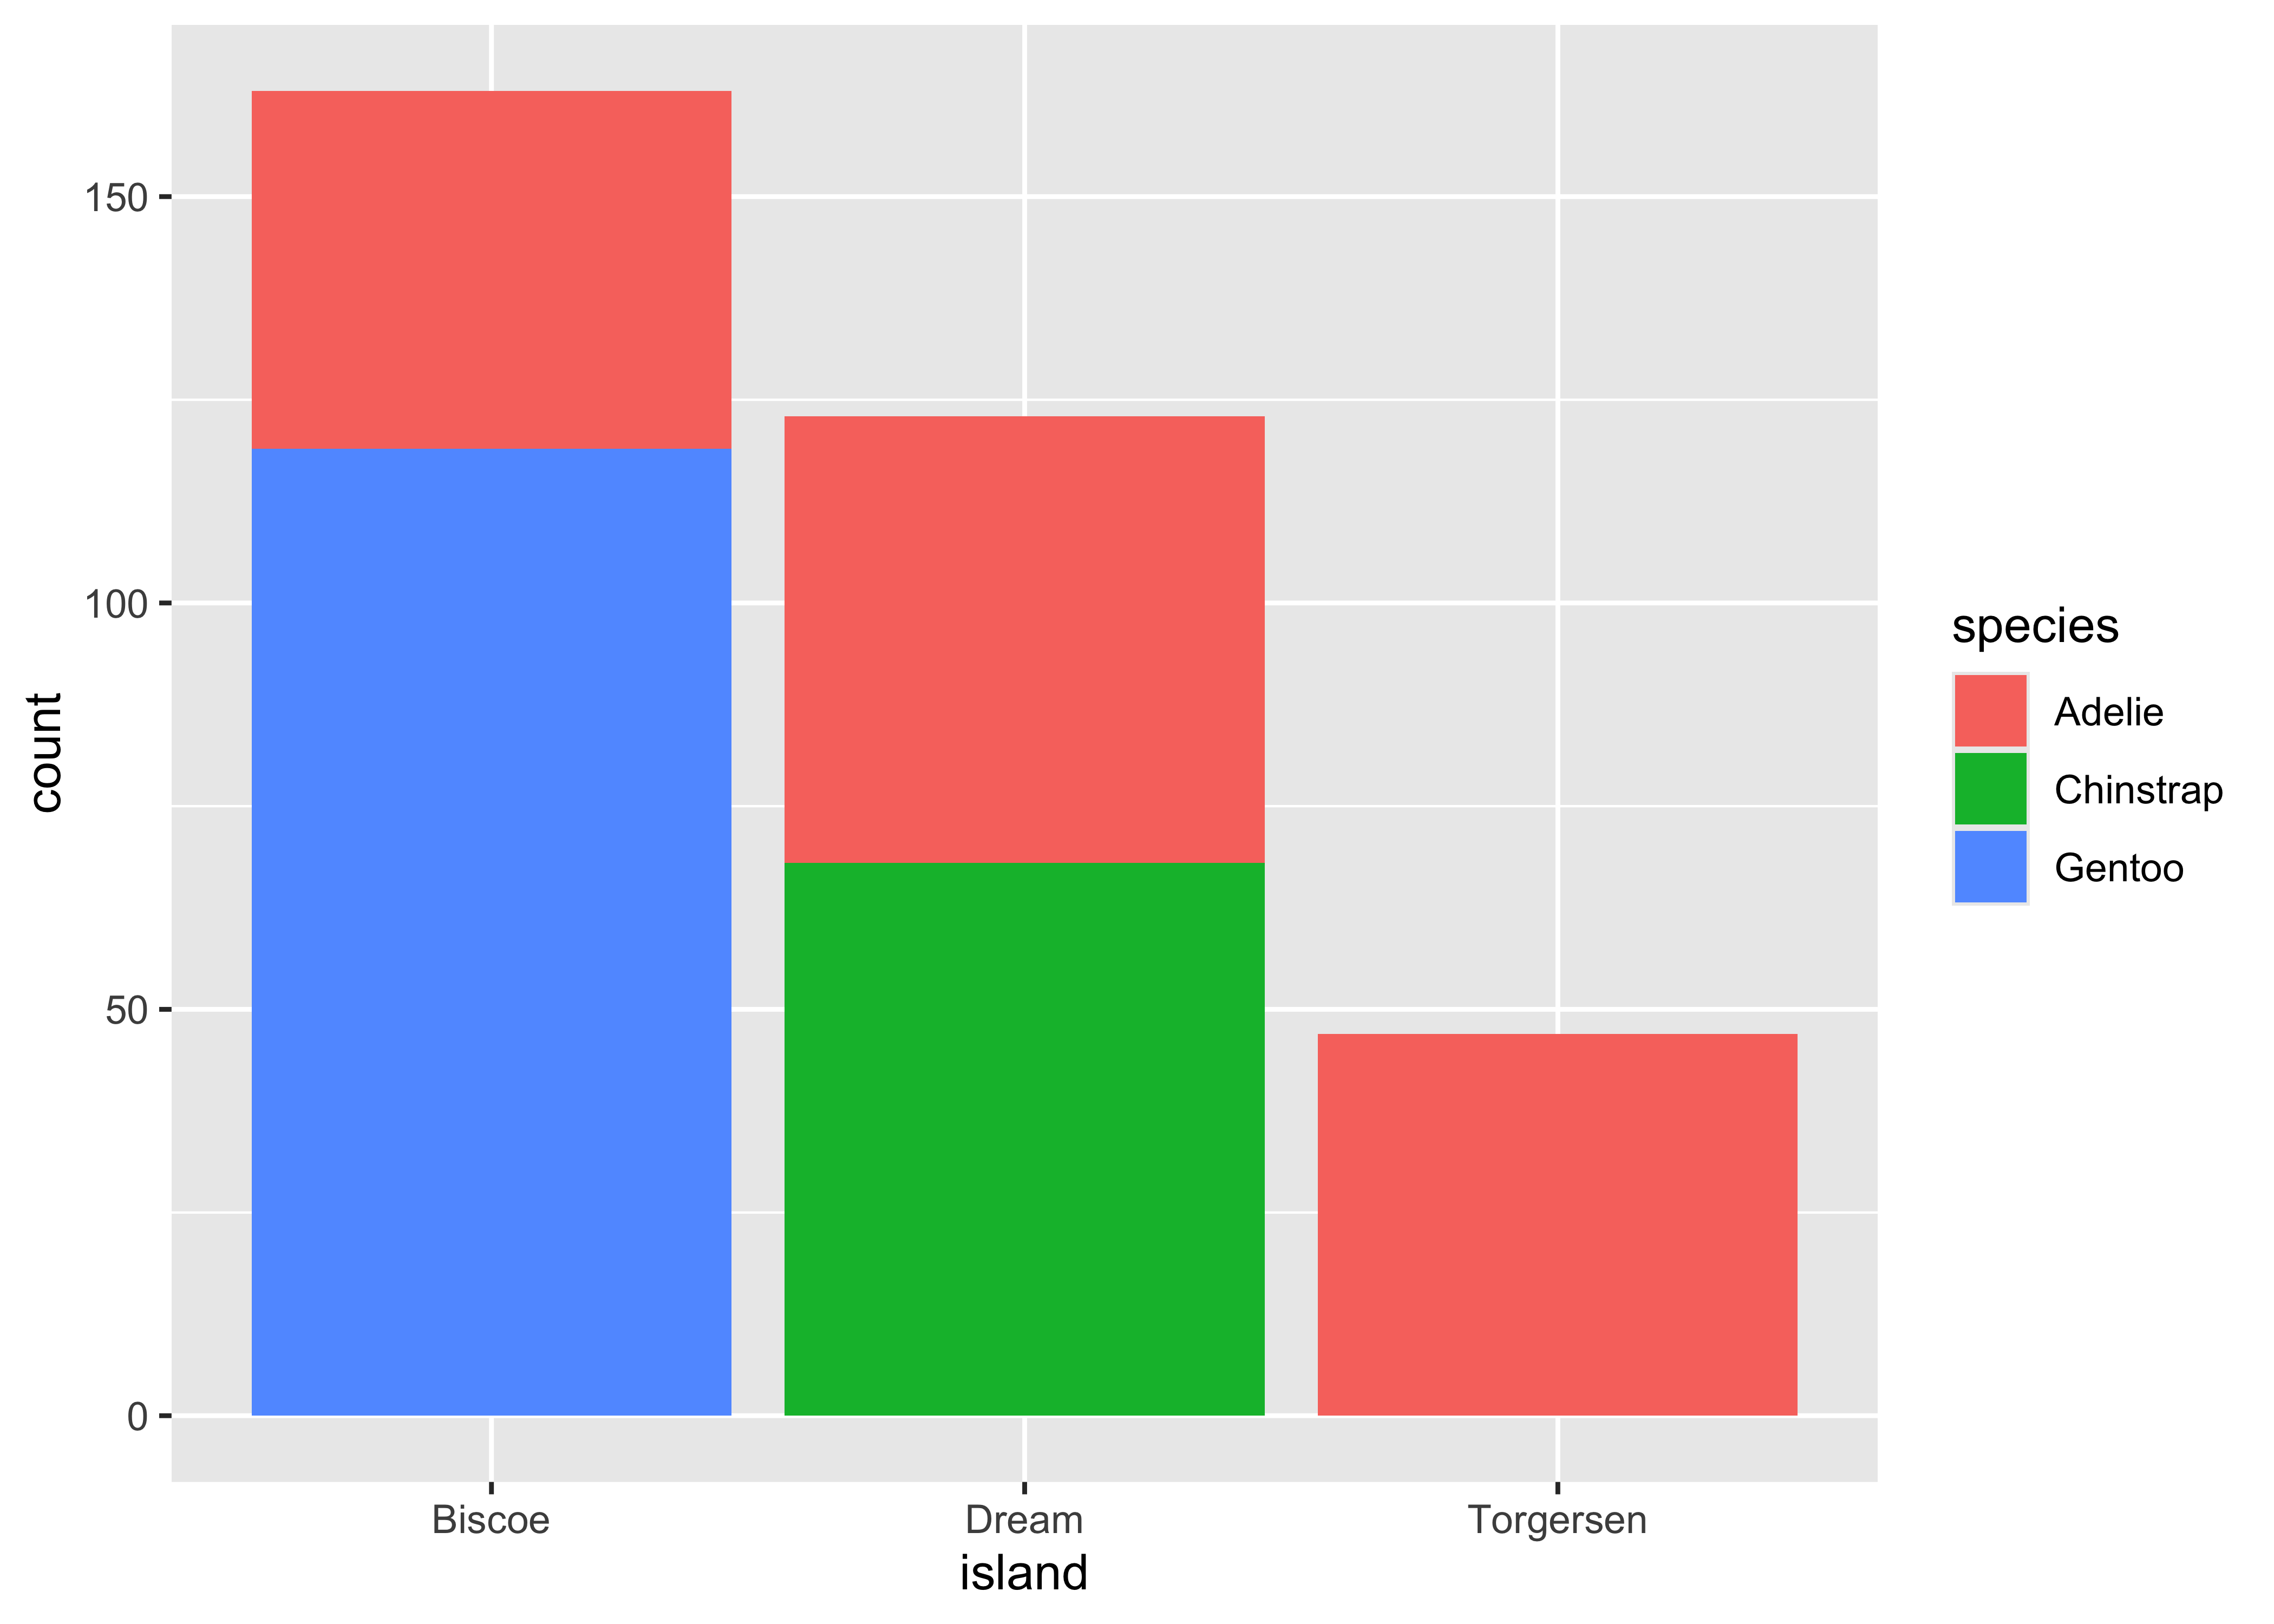
Storyline: तीन पेनगीन। और तुम भी तीन(Oh never mind!)
YOUR TURN-6
Two Variables: Quantitative vs Qualitative
Finally, what if we want to look at Quant variables and Qual variables together? What questions could we ask?
Questions: How much of this is Which Kind of that? How many vs Which? How many vs How?
Calculations: Counts, Means, Ranges etc., grouped by Categorical variable.
ggplot(penguins) +
  geom_density(
    aes(
      x = body_mass_g,
      color = island,
      fill = island
    ),
    alpha = 0.3
  )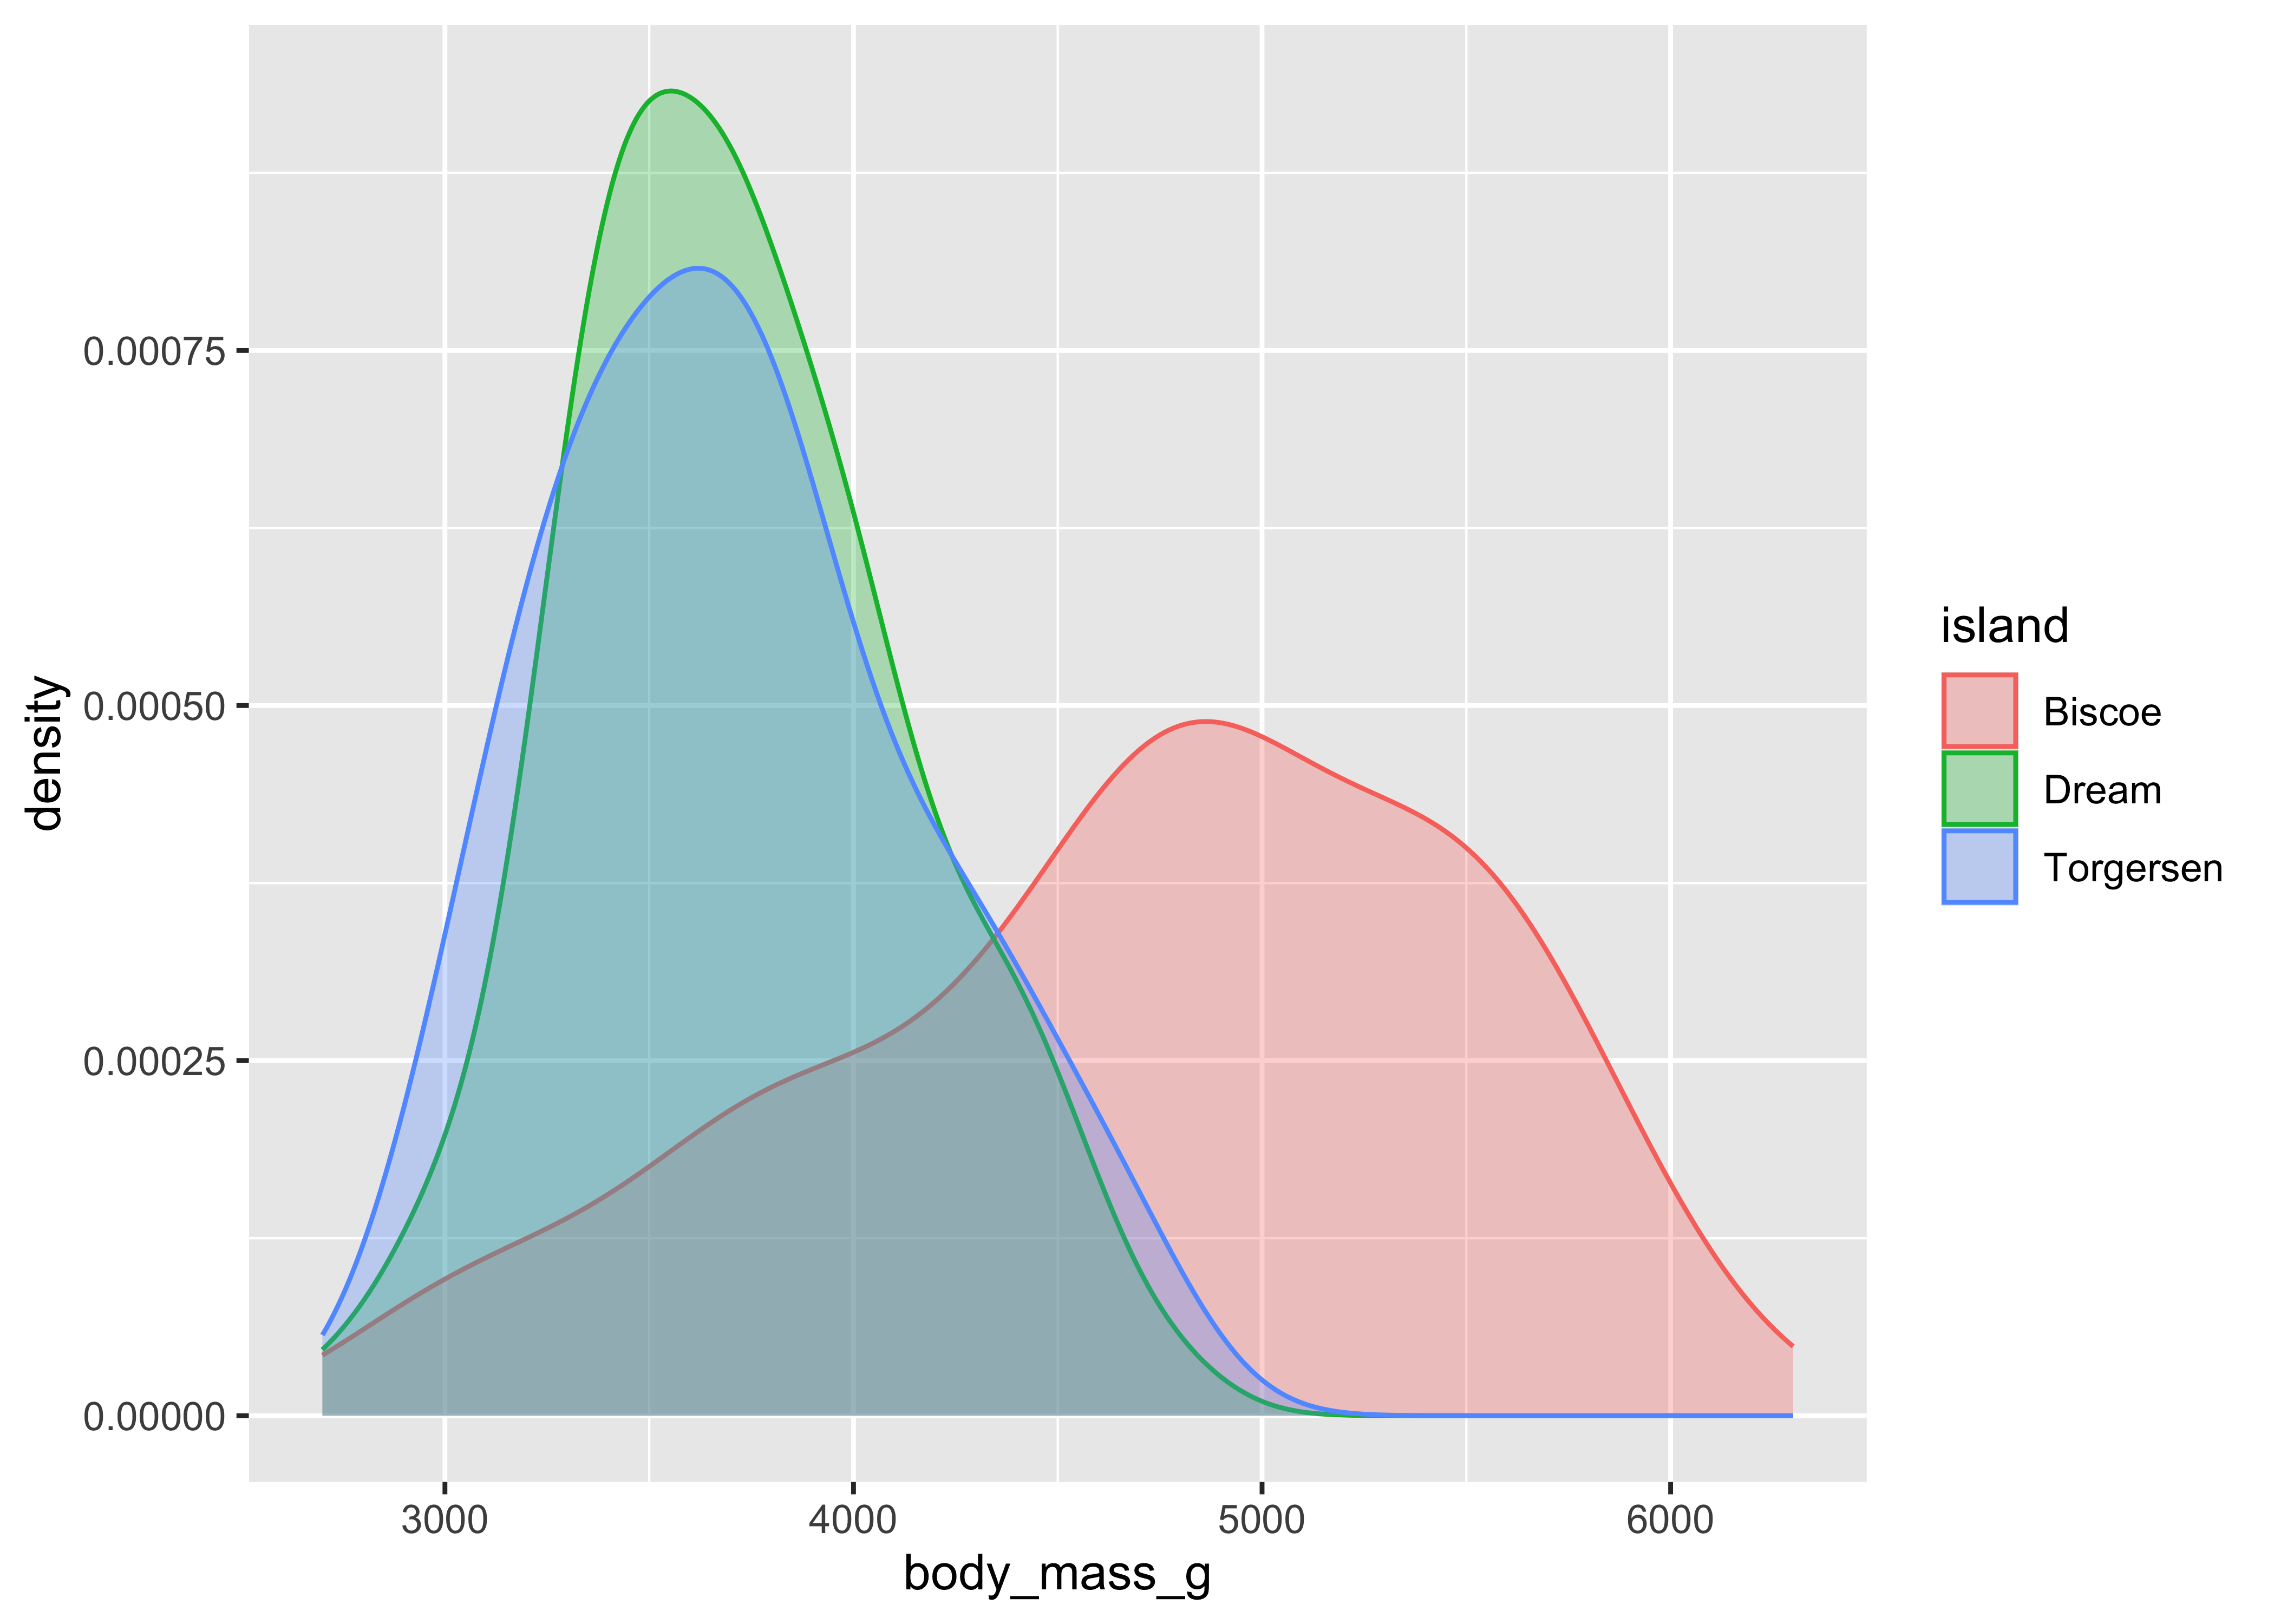
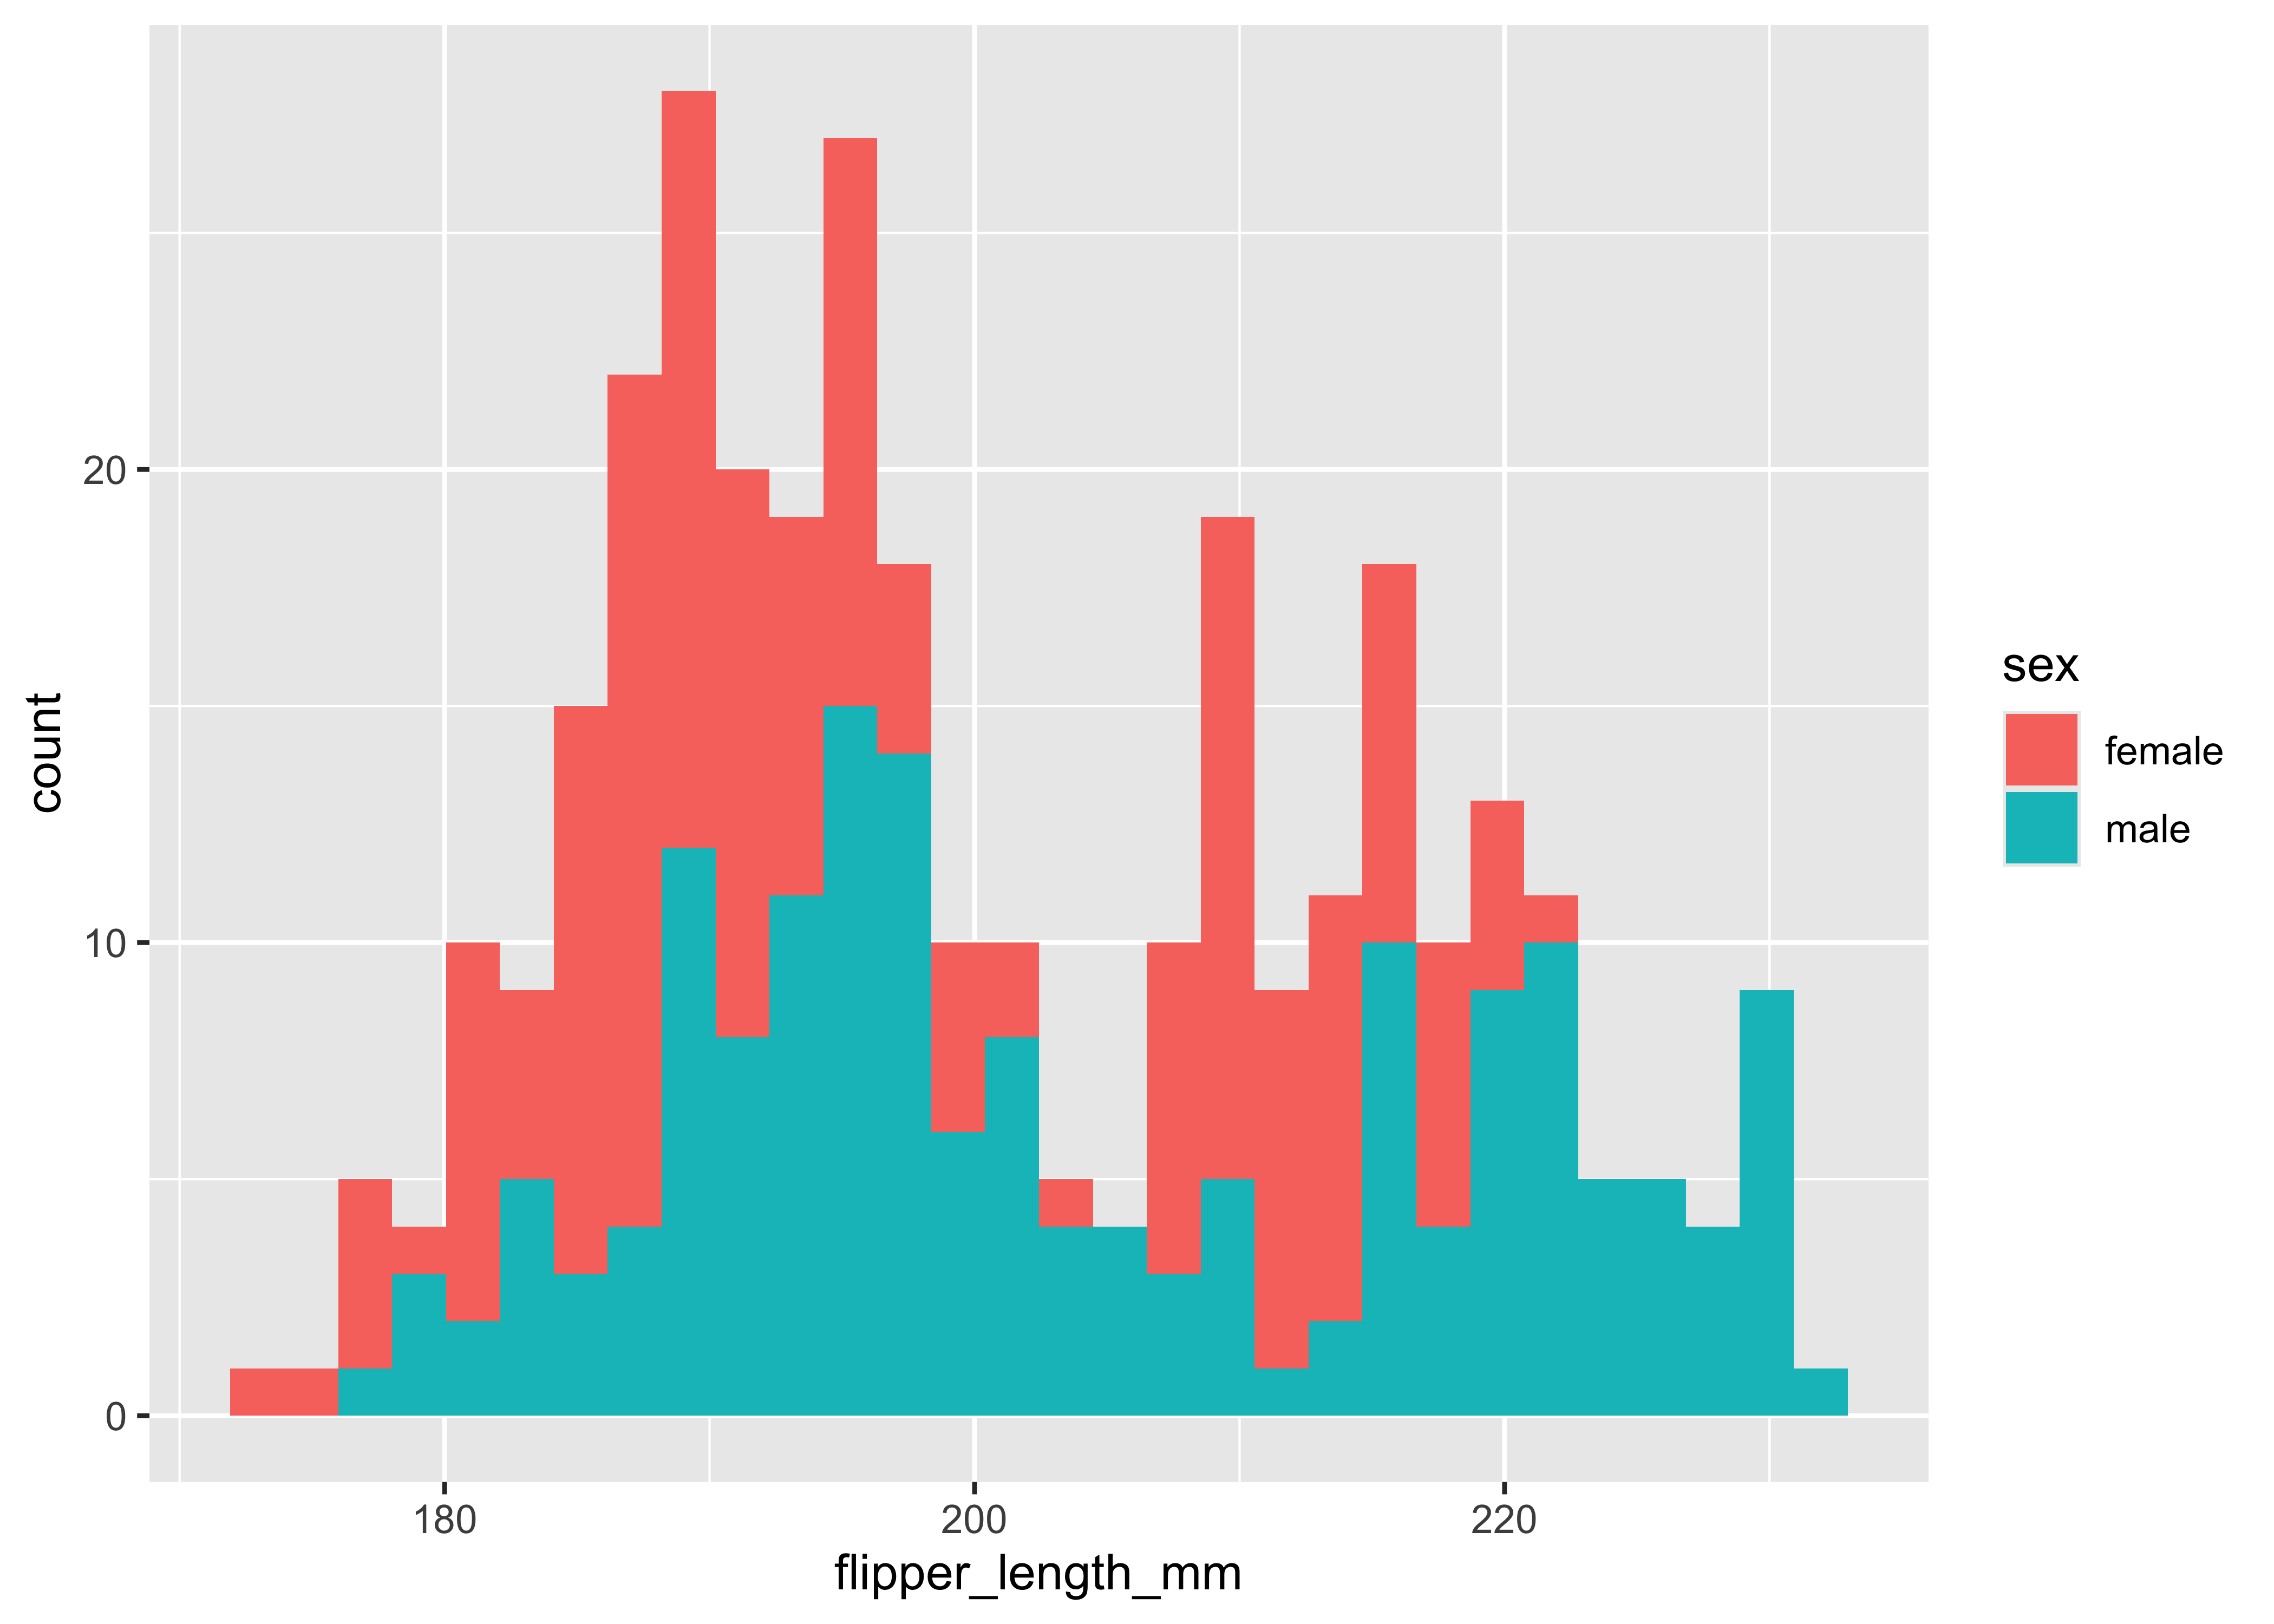
- Charts: Bar Chart using group / density plots by group / violin plots by group / box plots by group
-
geom_bar/geom_density/geom_violin/geom_boxplotusing Categorical Variable for grouping
ggplot(penguins) +
  geom_density(
    aes(
      x = body_mass_g,
      color = island,
      fill = island
    ),
    alpha = 0.3
  )
ggplot(penguins) +
  geom_histogram(aes(
    x = flipper_length_mm,
    fill = sex
  ))
YOUR TURN-7
Time to Play
- Create a fresh RMarkdown and similarly analyse two datasets of the following data sets
Any dataset in your R installation. Type
data()in your console to see what is available.diamonds. This dataset is part of the tidyverse package so just typediamondsin your code and there it is.gapminder!! Yes!!You will need to install thegapminderpackage to access this datasetmosaicDatapackage datasets. InstallmosaicDatadata.world: Find Datasets of your choice: https://docs.data.world/en/64499-64516-Quickstarts-and-tutorials.htmlkaggle: https://www.kaggle.com/datasets
References
- Data Visualization with R, Robert Kabacoff
- Good crisp descriptions of many kinds of graphs, no nonsense book. Available free on the web.
- Wickham and Grolemund, R for Data Science
- R Bible. Available free on the web.
- India Data Portal https://data.gov.in/
Ask me for help any time!