Setting up R Packages
Plot Theme and Fonts
Show the Code
```{r}
#| code-fold: true
#| message: false
#| warning: false

knitr::opts_chunk$set(
  fig.width = 7,
  fig.asp = 0.618, # Golden Ratio
  # out.width = "80%",
  fig.align = "center"
)
##
## https://stackoverflow.com/questions/36476751/associate-a-color-palette-with-ggplot2-theme
##
my_colours <- c("#fd7f6f", "#7eb0d5", "#b2e061", "#bd7ebe", "#ffb55a", "#ffee65", "#beb9db", "#fdcce5", "#8bd3c7")
my_pastels <- c("#66C5CC", "#F6CF71", "#F89C74", "#DCB0F2", "#87C55F", "#9EB9F3", "#FE88B1", "#C9DB74", "#8BE0A4", "#B497E7", "#D3B484", "#B3B3B3")
my_greys <- c("#000000", "#333333", "#666666", "#999999", "#cccccc")
my_vivids <- c("#E58606", "#5D69B1", "#52BCA3", "#99C945", "#CC61B0", "#24796C", "#DAA51B", "#2F8AC4", "#764E9F", "#ED645A", "#CC3A8E", "#A5AA99")

my_bolds <- c("#7F3C8D", "#11A579", "#3969AC", "#F2B701", "#E73F74", "#80BA5A", "#E68310", "#008695", "#CF1C90", "#f97b72", "#4b4b8f", "#A5AA99")

library(systemfonts)
library(showtext)
## Clean the slate
systemfonts::clear_local_fonts()
systemfonts::clear_registry()
##
showtext_opts(dpi = 96) # set DPI for showtext
sysfonts::font_add(
  family = "Alegreya",
  regular = "../../../../../../fonts/Alegreya-Regular.ttf",
  bold = "../../../../../../fonts/Alegreya-Bold.ttf",
  italic = "../../../../../../fonts/Alegreya-Italic.ttf",
  bolditalic = "../../../../../../fonts/Alegreya-BoldItalic.ttf"
)

sysfonts::font_add(
  family = "Roboto Condensed",
  regular = "../../../../../../fonts/RobotoCondensed-Regular.ttf",
  bold = "../../../../../../fonts/RobotoCondensed-Bold.ttf",
  italic = "../../../../../../fonts/RobotoCondensed-Italic.ttf",
  bolditalic = "../../../../../../fonts/RobotoCondensed-BoldItalic.ttf"
)
showtext_auto(enable = TRUE) # enable showtext
##
theme_custom <- function() {
  font <- "Alegreya" # assign font family up front

  theme_classic(base_size = 14, base_family = font) %+replace% # replace elements we want to change

    theme(
      text = element_text(family = font), # set base font family

      # text elements
      plot.title = element_text( # title
        family = font, # set font family
        size = 24, # set font size
        face = "bold", # bold typeface
        hjust = 0, # left align
        margin = margin(t = 5, r = 0, b = 5, l = 0)
      ), # margin
      plot.title.position = "plot",
      plot.subtitle = element_text( # subtitle
        family = font, # font family
        size = 14, # font size
        hjust = 0, # left align
        margin = margin(t = 5, r = 0, b = 10, l = 0)
      ), # margin

      plot.caption = element_text( # caption
        family = font, # font family
        size = 9, # font size
        hjust = 1
      ), # right align

      plot.caption.position = "plot", # right align

      plot.background = element_rect(fill = "navajowhite"),
      axis.title = element_text( # axis titles
        family = "Roboto Condensed", # font family
        size = 12
      ), # font size

      axis.text = element_text( # axis text
        family = "Roboto Condensed", # font family
        size = 9
      ), # font size

      axis.text.x = element_text( # margin for axis text
        margin = margin(5, b = 10)
      )

      # since the legend often requires manual tweaking
      # based on plot content, don't define it here
    )
}

## Use available fonts in ggplot text geoms too!
update_geom_defaults(geom = "text", new = list(
  family = "Roboto Condensed",
  face = "plain",
  size = 3.5,
  color = "#2b2b2b"
))

## Set the theme
theme_set(new = theme_custom())
```
Introduction
This is a dataset pertaining to gender and compensation at the workplace, modified for ease of analysis and plotting.
Data
[1] 2088 12year <dbl> | occupation <chr> | major_category <chr> | minor_category <chr> | |
|---|---|---|---|---|
| 2013 | Chief executives | Management, Business, and Financial | Management | |
| 2013 | General and operations managers | Management, Business, and Financial | Management | |
| 2013 | Legislators | Management, Business, and Financial | Management | |
| 2013 | Advertising and promotions managers | Management, Business, and Financial | Management | |
| 2013 | Marketing and sales managers | Management, Business, and Financial | Management | |
| 2013 | Public relations and fundraising managers | Management, Business, and Financial | Management | |
| 2013 | Administrative services managers | Management, Business, and Financial | Management | |
| 2013 | Computer and information systems managers | Management, Business, and Financial | Management | |
| 2013 | Financial managers | Management, Business, and Financial | Management | |
| 2013 | Compensation and benefits managers | Management, Business, and Financial | Management |
major_category <chr> | n <int> | |||
|---|---|---|---|---|
| Computer, Engineering, and Science | 236 | |||
| Education, Legal, Community Service, Arts, and Media | 168 | |||
| Healthcare Practitioners and Technical | 128 | |||
| Management, Business, and Financial | 232 | |||
| Natural Resources, Construction, and Maintenance | 328 | |||
| Production, Transportation, and Material Moving | 444 | |||
| Sales and Office | 280 | |||
| Service | 272 |
minor_category <chr> | n <int> | |||
|---|---|---|---|---|
| Architecture and Engineering | 84 | |||
| Arts, Design, Entertainment, Sports, and Media | 72 | |||
| Building and Grounds Cleaning and Maintenance | 24 | |||
| Business and Financial Operations | 112 | |||
| Community and Social Service | 32 | |||
| Computer and mathematical | 64 | |||
| Construction and Extraction | 152 | |||
| Education, Training, and Library | 44 | |||
| Farming, Fishing, and Forestry | 32 | |||
| Food Preparation and Serving Related | 52 |
occupation <chr> | n <int> | |||
|---|---|---|---|---|
| Accountants and auditors | 4 | |||
| Actors | 4 | |||
| Actuaries | 4 | |||
| Adhesive bonding machine operators and tenders | 4 | |||
| Administrative services managers | 4 | |||
| Advertising and promotions managers | 4 | |||
| Advertising sales agents | 4 | |||
| Aerospace engineers | 4 | |||
| Agents and business managers of artists, performers, and athletes | 4 | |||
| Agricultural and food science technicians | 4 |
Download the Modified data
Data Dictionary
Quantitative Variables
Write in.
Qualitative Variables
Write in.
Observations
Write in.
Plot the Data
Task and Discussion
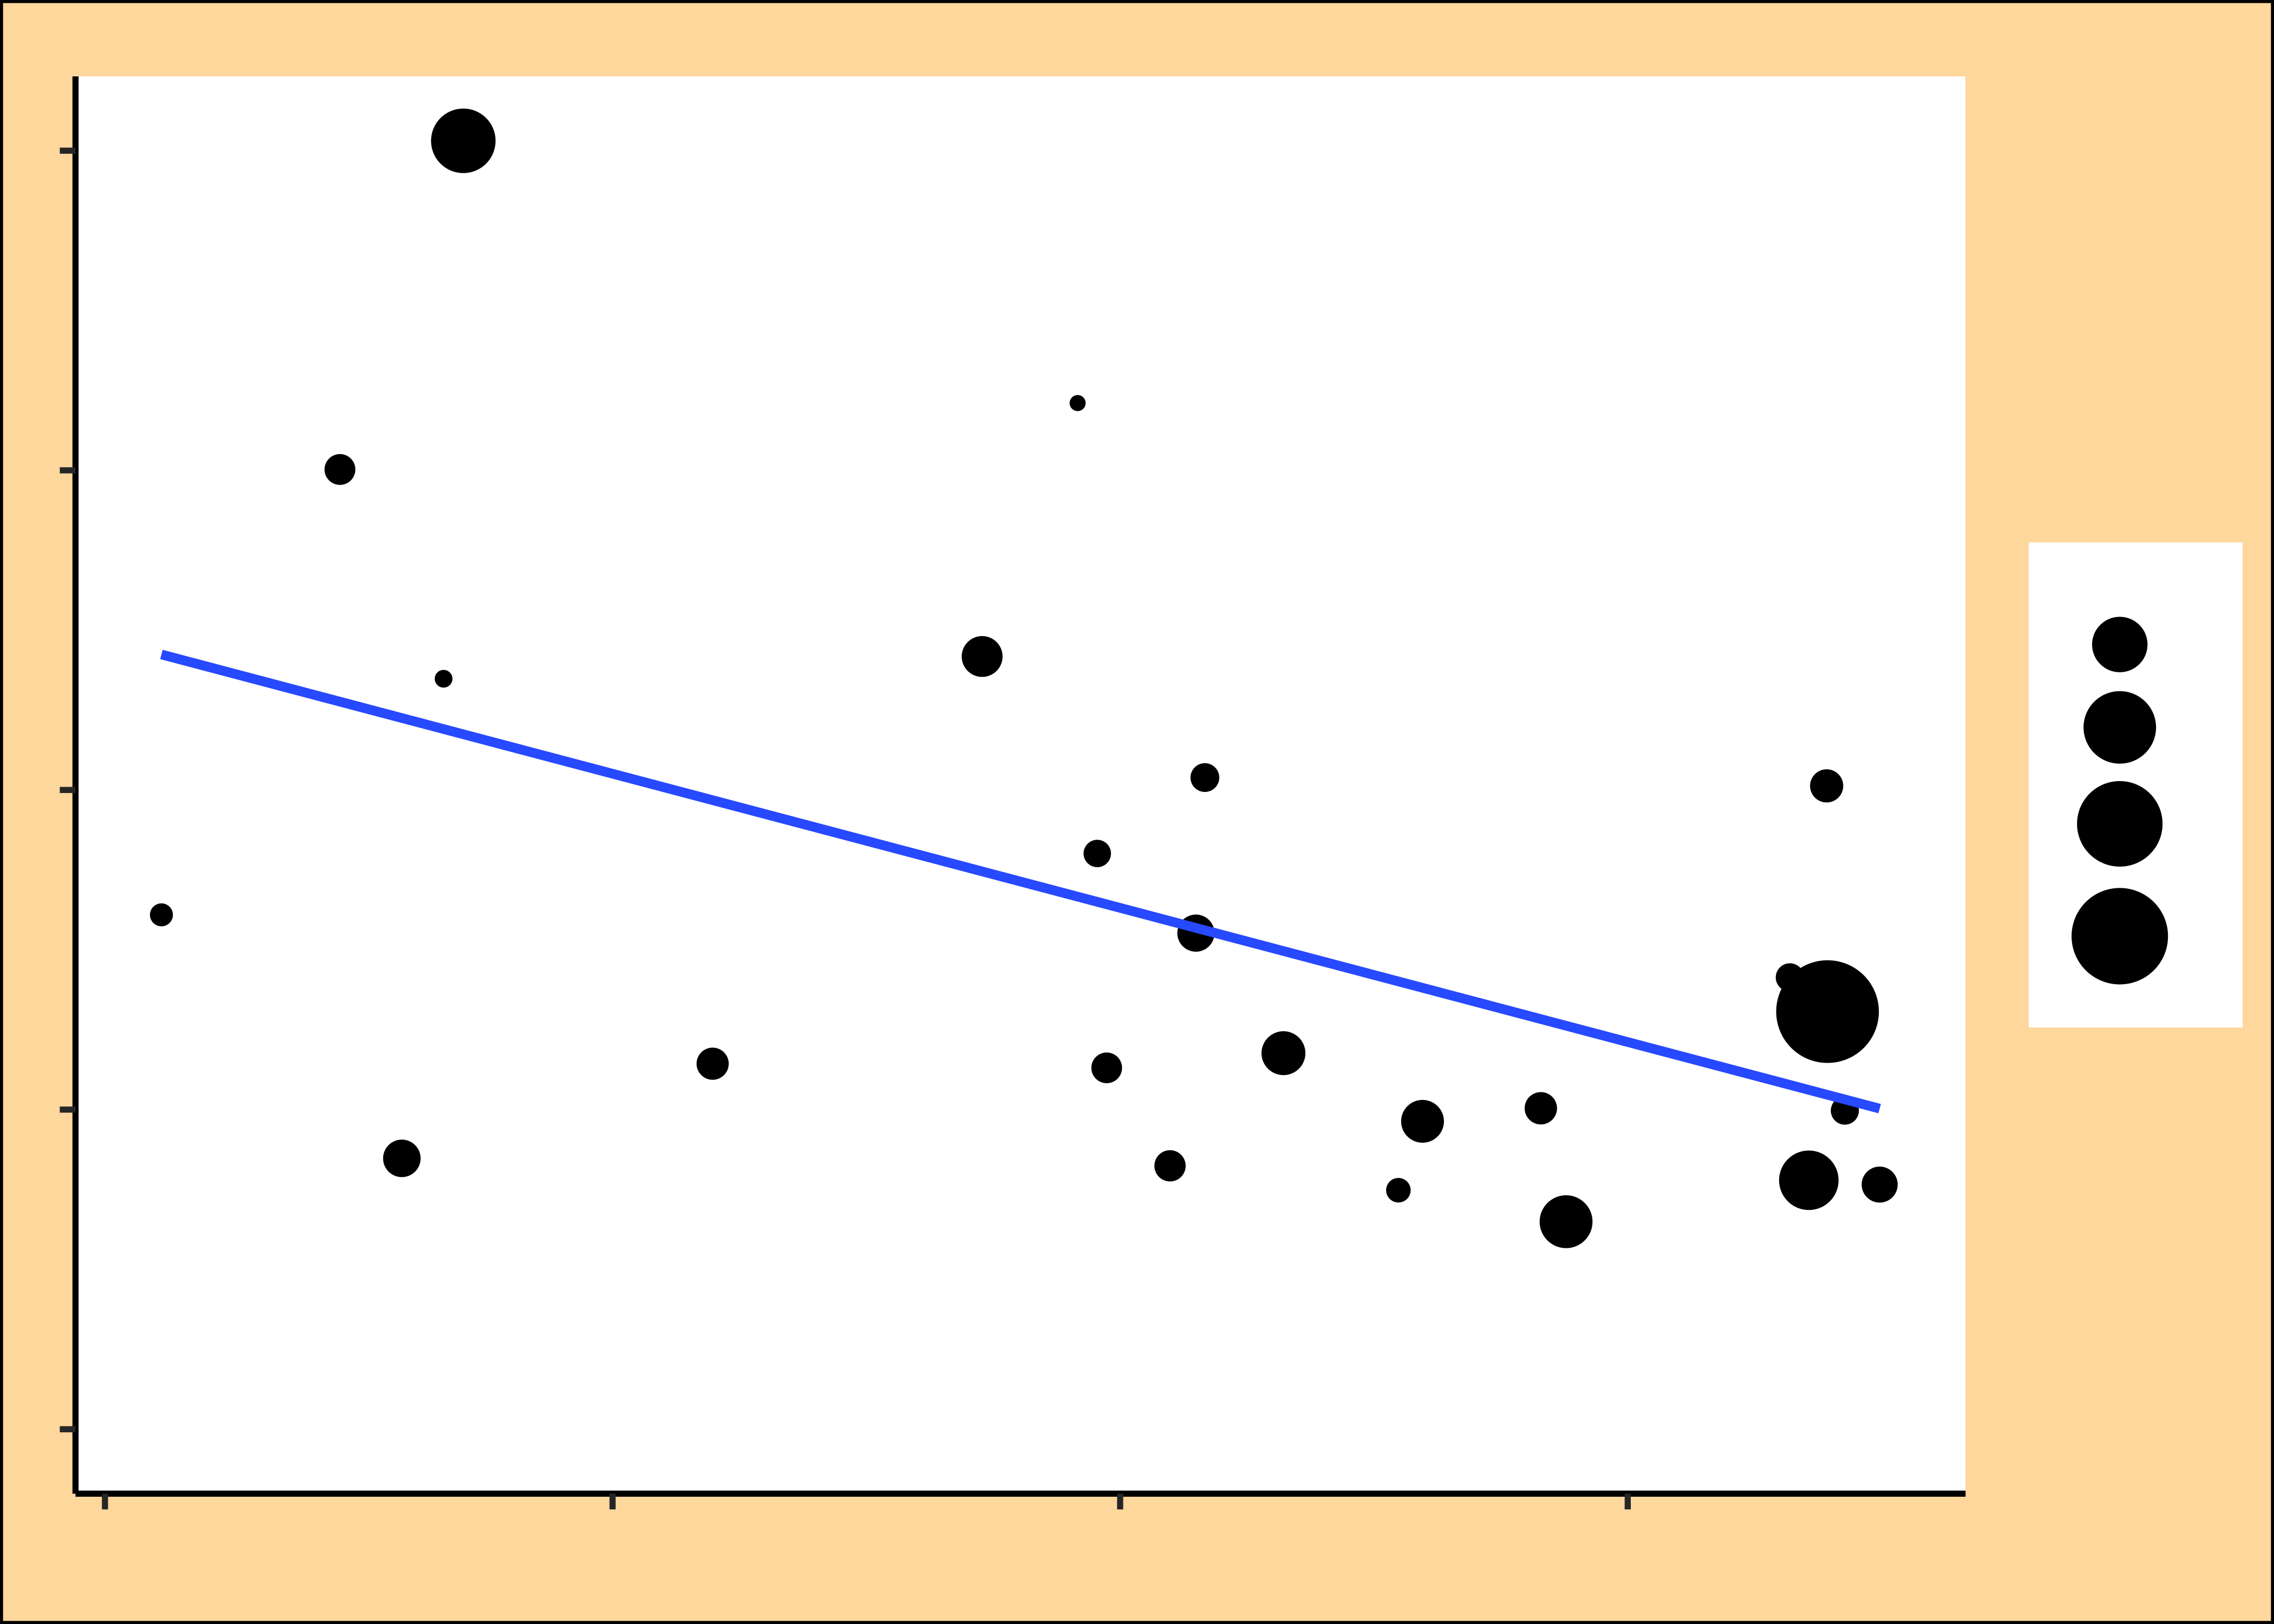
Complete the Data Dictionary. Create the graph shown and discuss the following questions:
- What kind of chart is used in the figure?
- What geometries have been used and to which variables have these geometries been mapped?
- Based on this graph, do you think gender plays a role in salaries? What is the trend you see?
- If SALARY, NO_OF_WORKERS, GENDER, OCCUPATION were available in the original dataset, what pre-processing would have been necessary to obtain this plot?