Setting up R Packages
Plot Theme
Show the Code
# https://stackoverflow.com/questions/74491138/ggplot-custom-fonts-not-working-in-quarto

# Chunk options
knitr::opts_chunk$set(
  fig.width = 7,
  fig.asp = 0.618, # Golden Ratio
  # out.width = "80%",
  fig.align = "center"
)
### Ggplot Theme
### https://rpubs.com/mclaire19/ggplot2-custom-themes

theme_custom <- function() {
  font <- "Roboto Condensed" # assign font family up front

  theme_classic(base_size = 14) %+replace% # replace elements we want to change

    theme(
      panel.grid.minor = element_blank(), # strip minor gridlines
      text = element_text(family = font),
      # text elements
      plot.title = element_text( # title
        family = font, # set font family
        size = 16, # set font size
        face = "bold", # bold typeface
        hjust = 0, # left align
        # vjust = 2                #raise slightly
        margin = margin(0, 0, 10, 0)
      ),
      plot.subtitle = element_text( # subtitle
        family = font, # font family
        size = 14, # font size
        hjust = 0,
        margin = margin(2, 0, 5, 0)
      ),
      plot.caption = element_text( # caption
        family = font, # font family
        size = 8, # font size
        hjust = 1
      ), # right align

      axis.title = element_text( # axis titles
        family = font, # font family
        size = 10 # font size
      ),
      axis.text = element_text( # axis text
        family = font, # axis family
        size = 8
      ) # font size
    )
}

# Set graph theme
theme_set(new = theme_custom())
#
Introduction
This dataset pertains to spending on gifts by various people for Valentine’s Day. This was part of the TidyTuesday Project for February 2024!
Read the Data
gifts_age <- readr::read_csv("https://raw.githubusercontent.com/rfordatascience/tidytuesday/master/data/2024/2024-02-13/gifts_age.csv")
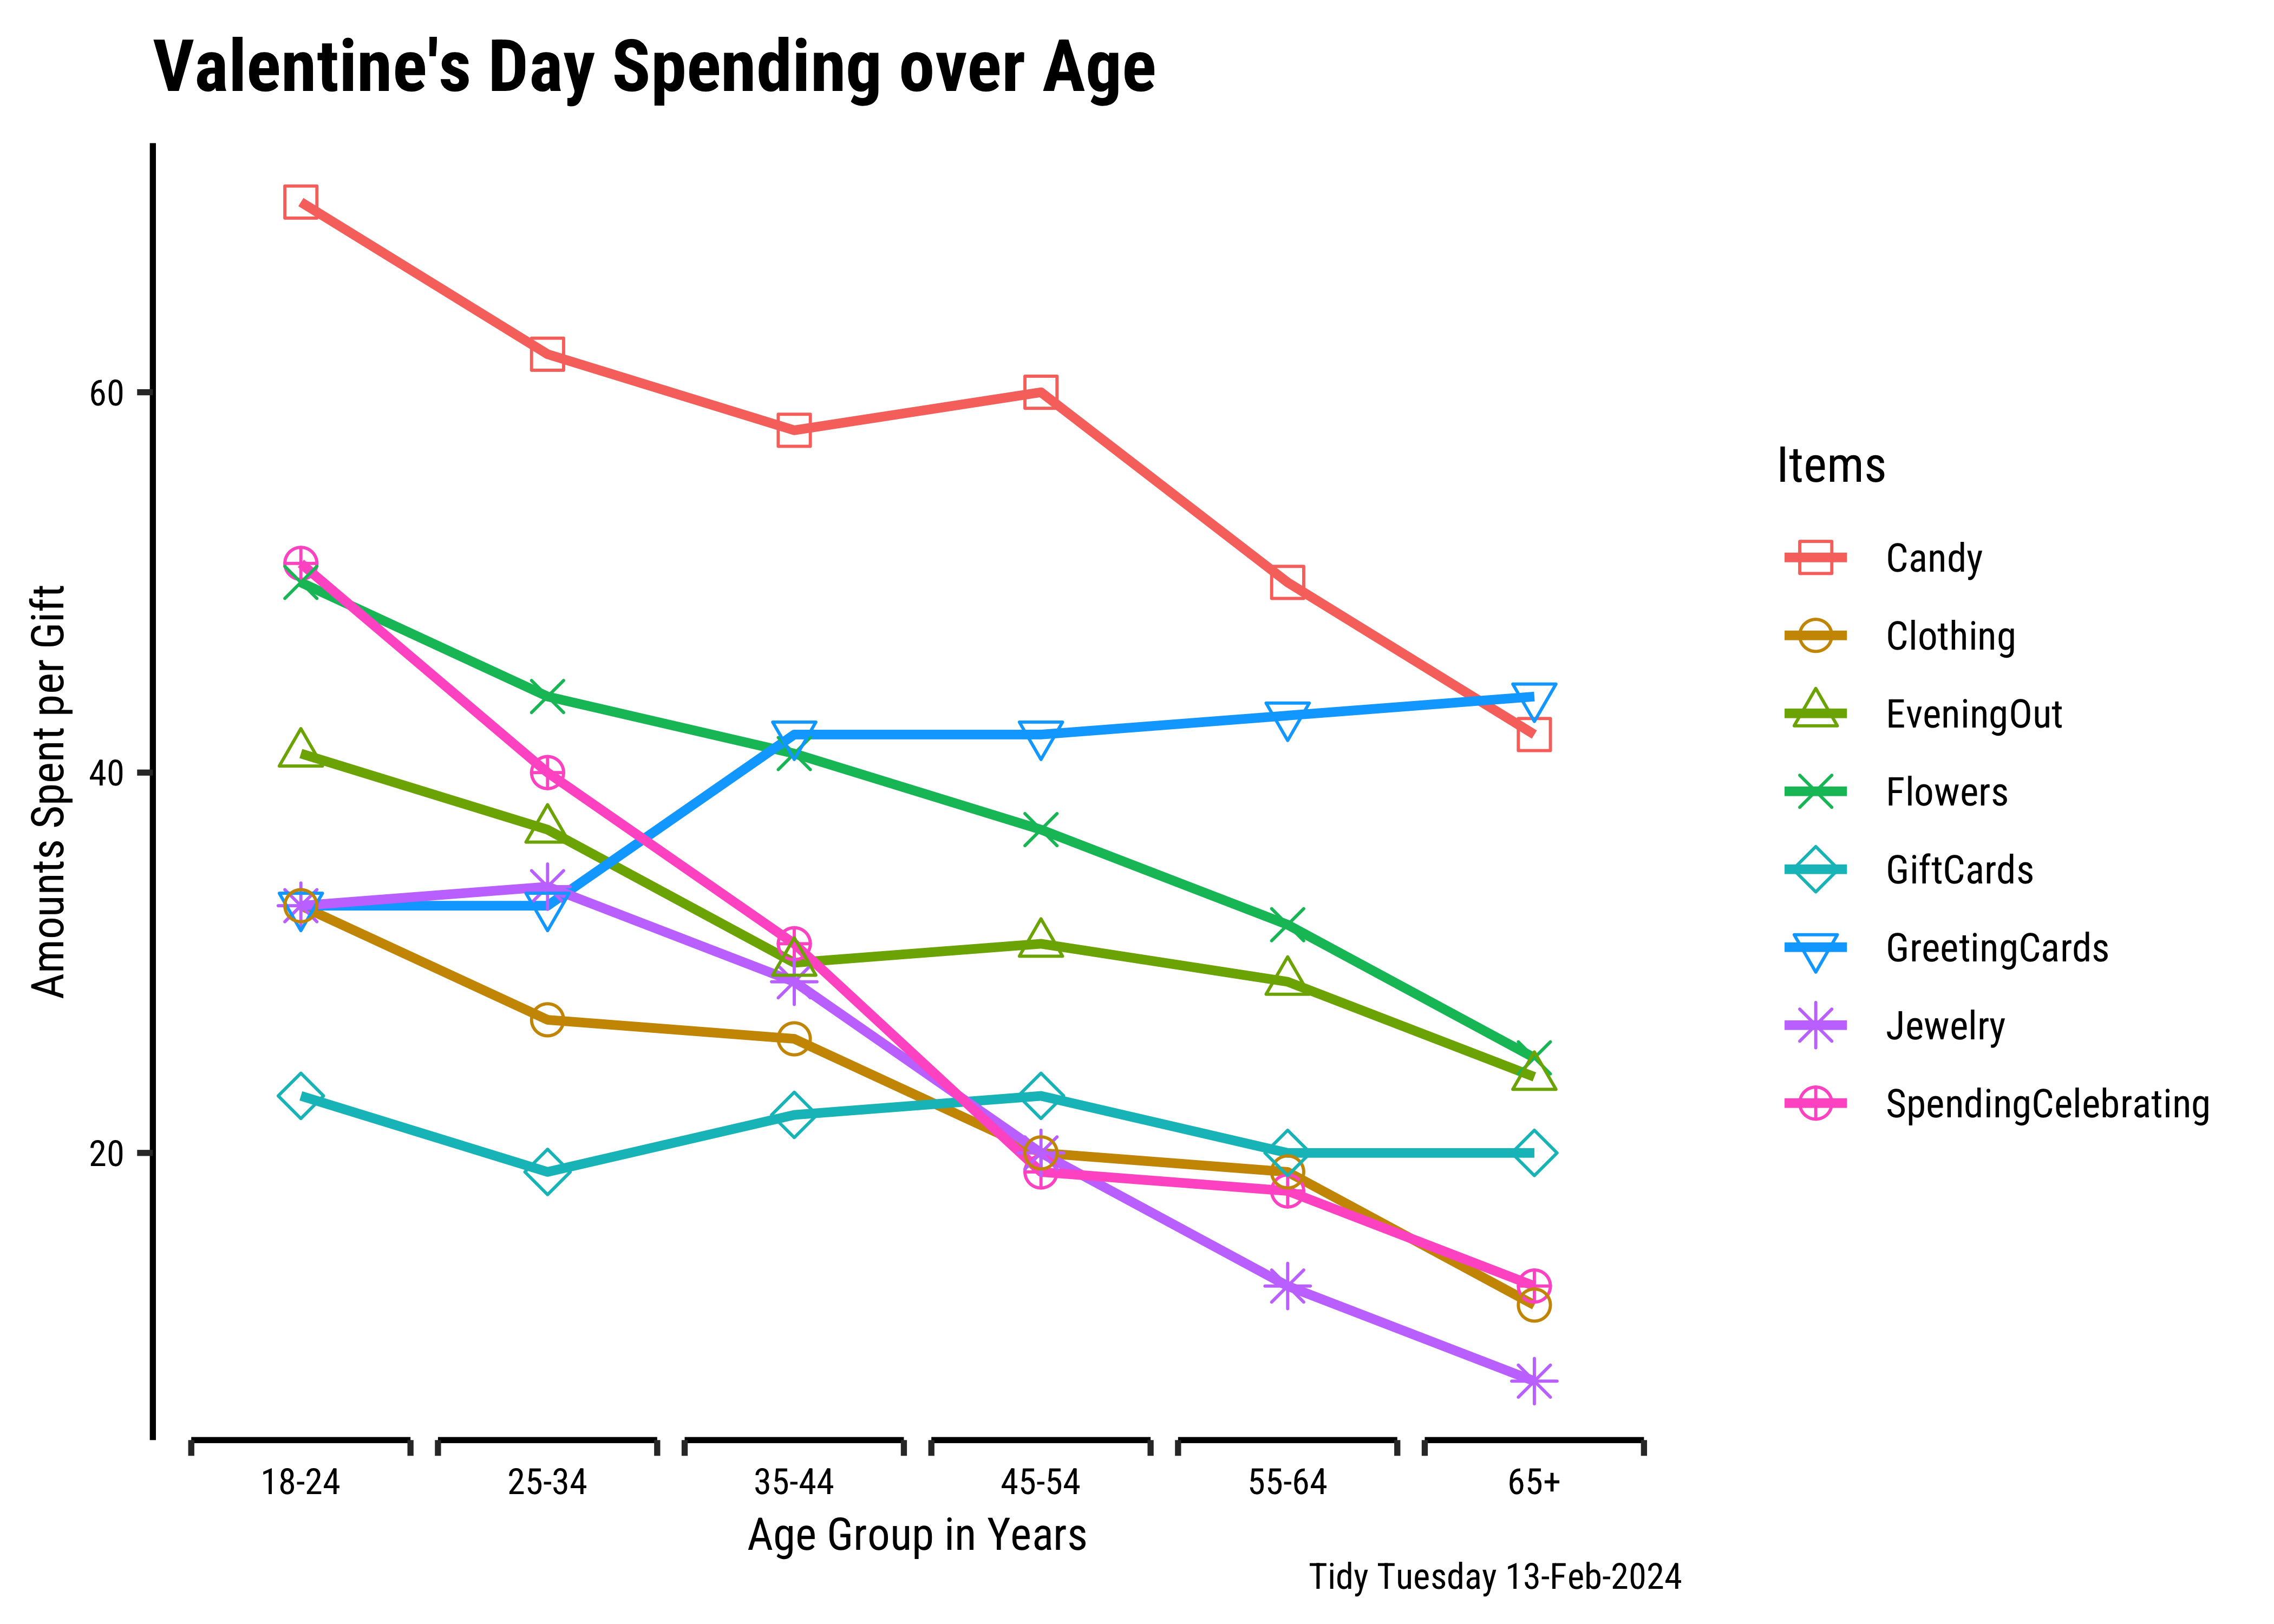
glimpse(gifts_age)Rows: 6
Columns: 9
$ Age <chr> "18-24", "25-34", "35-44", "45-54", "55-64", "65+"
$ SpendingCelebrating <dbl> 51, 40, 31, 19, 18, 13
$ Candy <dbl> 70, 62, 58, 60, 50, 42
$ Flowers <dbl> 50, 44, 41, 37, 32, 25
$ Jewelry <dbl> 33, 34, 29, 20, 13, 8
$ GreetingCards <dbl> 33, 33, 42, 42, 43, 44
$ EveningOut <dbl> 41, 37, 30, 31, 29, 24
$ Clothing <dbl> 33, 27, 26, 20, 19, 12
$ GiftCards <dbl> 23, 19, 22, 23, 20, 20Data Dictionary
Quantitative Variables
Write in.
Qualitative Variables
Write in.
Observations
Write in.
Analyse/Transform the Data
```{r}
#| label: data-preprocessing
#
# Write in your code here
# to prepare this data as shown below
# to generate the plot that follows
# Change data to factors etc.
# Set up Counts, histograms etc
```
Research Question
Note
Write in!! Look at the Chart!
Plot the Data
Task and Discussion
- Complete the Data Dictionary.
- Select and Transform the variables as shown.
- Create the graphs shown and discuss the following questions:
- Identify the type of charts
- Identify the variables used for various geometrical aspects (x, y, fill…). Name the variables appropriately.
- What research activity might have been carried out to obtain the data graphed here? Provide some details.
- What pre-processing of the data was required to create the chart?
- What might be the Hypothesis / Research Question, based on the Chart?
- Write a 2-line story based on the chart, describing your inference/surprise.
References
To obtain that cool-looking X-axis in the chart, you need to use a new package called ggprism. Look at the vignette there and copy the code to make the X-axis like what you see here.