Coffee with Hansel and Gretel
Setting up R Packages
Show the Code
extrafont::loadfonts(quiet = TRUE)
font <- "Roboto Condensed"
theme_set(new = theme_classic(base_size = 14))

theme_update(
  panel.grid.minor = element_blank(),
  text = element_text(family = font),
  # text elements
  plot.title = element_text( # title
    family = font, # set font family
    size = 20, # set font size
    face = "bold", # bold typeface
    hjust = 0, # left align
    # vjust = 2                #raise slightly
    margin = margin(0, 0, 10, 0)
  ),
  plot.subtitle = element_text( # subtitle
    family = font, # font family
    size = 14, # font size
    hjust = 0,
    margin = margin(2, 0, 5, 0)
  ),
  plot.caption = element_text( # caption
    family = font, # font family
    size = 8, # font size
    hjust = 1
  ), # right align

  axis.title = element_text( # axis titles
    family = font, # font family
    size = 10 # font size
  ),
  axis.text = element_text( # axis text
    family = font, # axis family
    size = 8
  ) # font size
)
Introduction
This dataset pertains to scores various types of coffees on parameters such as aroma, flavour, after-taste etc.
Since there are some interesting pre-processing actions required of data, and some choices to be made as well, I will leave some breadcrumbs, and some intermediate results, for you to look at and figure out the analysis/EDA path that you might take! You can then vary these at will after getting a measure of confidence!
Read the Data
Rows: 1,339
Columns: 43
$ total_cup_points      <dbl> 90.58, 89.92, 89.75, 89.00, 88.83, 88.83, 88.75,…
$ species               <chr> "Arabica", "Arabica", "Arabica", "Arabica", "Ara…
$ owner                 <chr> "metad plc", "metad plc", "grounds for health ad…
$ country_of_origin     <chr> "Ethiopia", "Ethiopia", "Guatemala", "Ethiopia",…
$ farm_name             <chr> "metad plc", "metad plc", "san marcos barrancas …
$ lot_number            <chr> NA, NA, NA, NA, NA, NA, NA, NA, NA, NA, NA, NA, …
$ mill                  <chr> "metad plc", "metad plc", NA, "wolensu", "metad …
$ ico_number            <chr> "2014/2015", "2014/2015", NA, NA, "2014/2015", N…
$ company               <chr> "metad agricultural developmet plc", "metad agri…
$ altitude              <chr> "1950-2200", "1950-2200", "1600 - 1800 m", "1800…
$ region                <chr> "guji-hambela", "guji-hambela", NA, "oromia", "g…
$ producer              <chr> "METAD PLC", "METAD PLC", NA, "Yidnekachew Dabes…
$ number_of_bags        <dbl> 300, 300, 5, 320, 300, 100, 100, 300, 300, 50, 3…
$ bag_weight            <chr> "60 kg", "60 kg", "1", "60 kg", "60 kg", "30 kg"…
$ in_country_partner    <chr> "METAD Agricultural Development plc", "METAD Agr…
$ harvest_year          <chr> "2014", "2014", NA, "2014", "2014", "2013", "201…
$ grading_date          <chr> "April 4th, 2015", "April 4th, 2015", "May 31st,…
$ owner_1               <chr> "metad plc", "metad plc", "Grounds for Health Ad…
$ variety               <chr> NA, "Other", "Bourbon", NA, "Other", NA, "Other"…
$ processing_method     <chr> "Washed / Wet", "Washed / Wet", NA, "Natural / D…
$ aroma                 <dbl> 8.67, 8.75, 8.42, 8.17, 8.25, 8.58, 8.42, 8.25, …
$ flavor                <dbl> 8.83, 8.67, 8.50, 8.58, 8.50, 8.42, 8.50, 8.33, …
$ aftertaste            <dbl> 8.67, 8.50, 8.42, 8.42, 8.25, 8.42, 8.33, 8.50, …
$ acidity               <dbl> 8.75, 8.58, 8.42, 8.42, 8.50, 8.50, 8.50, 8.42, …
$ body                  <dbl> 8.50, 8.42, 8.33, 8.50, 8.42, 8.25, 8.25, 8.33, …
$ balance               <dbl> 8.42, 8.42, 8.42, 8.25, 8.33, 8.33, 8.25, 8.50, …
$ uniformity            <dbl> 10.00, 10.00, 10.00, 10.00, 10.00, 10.00, 10.00,…
$ clean_cup             <dbl> 10, 10, 10, 10, 10, 10, 10, 10, 10, 10, 10, 10, …
$ sweetness             <dbl> 10.00, 10.00, 10.00, 10.00, 10.00, 10.00, 10.00,…
$ cupper_points         <dbl> 8.75, 8.58, 9.25, 8.67, 8.58, 8.33, 8.50, 9.00, …
$ moisture              <dbl> 0.12, 0.12, 0.00, 0.11, 0.12, 0.11, 0.11, 0.03, …
$ category_one_defects  <dbl> 0, 0, 0, 0, 0, 0, 0, 0, 0, 0, 0, 0, 0, 0, 0, 0, …
$ quakers               <dbl> 0, 0, 0, 0, 0, 0, 0, 0, 0, 0, 0, 0, 0, 0, 0, 0, …
$ color                 <chr> "Green", "Green", NA, "Green", "Green", "Bluish-…
$ category_two_defects  <dbl> 0, 1, 0, 2, 2, 1, 0, 0, 0, 4, 1, 0, 0, 2, 2, 0, …
$ expiration            <chr> "April 3rd, 2016", "April 3rd, 2016", "May 31st,…
$ certification_body    <chr> "METAD Agricultural Development plc", "METAD Agr…
$ certification_address <chr> "309fcf77415a3661ae83e027f7e5f05dad786e44", "309…
$ certification_contact <chr> "19fef5a731de2db57d16da10287413f5f99bc2dd", "19f…
$ unit_of_measurement   <chr> "m", "m", "m", "m", "m", "m", "m", "m", "m", "m"…
$ altitude_low_meters   <dbl> 1950.0, 1950.0, 1600.0, 1800.0, 1950.0, NA, NA, …
$ altitude_high_meters  <dbl> 2200.0, 2200.0, 1800.0, 2200.0, 2200.0, NA, NA, …
$ altitude_mean_meters <dbl> 2075.0, 2075.0, 1700.0, 2000.0, 2075.0, NA, NA, …Inspect, Clean the Data
What are the non-numeric, or Qualitative variables here?
name <chr> | class <chr> | levels <int> | n <int> | missing <int> | distribution <chr> |
|---|---|---|---|---|---|
| species | character | 2 | 1339 | 0 | Arabica (97.9%), Robusta (2.1%) |
| owner | character | 315 | 1332 | 7 | juan luis alvarado romero (11.6%) ... |
| country_of_origin | character | 36 | 1338 | 1 | Mexico (17.6%), Colombia (13.7%) ... |
| farm_name | character | 571 | 980 | 359 | various (4.8%), rio verde (2.3%) ... |
| lot_number | character | 227 | 276 | 1063 | 1 (6.5%), 020/17 (2.2%) ... |
| mill | character | 460 | 1024 | 315 | beneficio ixchel (8.8%) ... |
| ico_number | character | 847 | 1188 | 151 | 0 (6.5%), Taiwan (2.6%) ... |
| company | character | 281 | 1130 | 209 | unex guatemala, s.a. (7.6%) ... |
| altitude | character | 396 | 1113 | 226 | 1100 (3.9%), 1200 (3.8%) ... |
| region | character | 356 | 1280 | 59 | huila (8.8%), oriente (6.2%) ... |
Look at the number of levels in those Qual variables!!Some are too many and some are so few… Suppose we count the data on the basis of a few?
processing_method <chr> | n <int> | |||
|---|---|---|---|---|
| Natural / Dry | 258 | |||
| Other | 26 | |||
| Pulped natural / honey | 14 | |||
| Semi-washed / Semi-pulped | 56 | |||
| Washed / Wet | 815 | |||
| NA | 170 |
country_of_origin <chr> | n <int> | |||
|---|---|---|---|---|
| Brazil | 132 | |||
| Burundi | 2 | |||
| China | 16 | |||
| Colombia | 183 | |||
| Costa Rica | 51 | |||
| Cote d?Ivoire | 1 | |||
| Ecuador | 3 | |||
| El Salvador | 21 | |||
| Ethiopia | 44 | |||
| Guatemala | 181 |
Why did I choose these Qual factors to count with?
Data Dictionary
Write in.
Write in.
Write in.
Research Question
Among the country_of_origin with the 5 highest average total_cup_points, how do the average ratings vary in ranks on the other coffee parameters?
Why this somewhat long-winded question? Why all this averagestuff??
Why did I choose country_of_origin?Are there any other options?
Analyse/Transform the Data
```{r}
#| label: data-preprocessing
#
# Write in your code here
# to prepare this data as shown below
# to generate the plot that follows
```country_of_origin <chr> | total_cup_points <dbl> | aroma <dbl> | flavor <dbl> | aftertaste <dbl> | acidity <dbl> | body <dbl> |
|---|---|---|---|---|---|---|
| Ethiopia | 90.58 | 8.67 | 8.83 | 8.67 | 8.75 | 8.50 |
| Ethiopia | 89.92 | 8.75 | 8.67 | 8.50 | 8.58 | 8.42 |
| Guatemala | 89.75 | 8.42 | 8.50 | 8.42 | 8.42 | 8.33 |
| Ethiopia | 89.00 | 8.17 | 8.58 | 8.42 | 8.42 | 8.50 |
| Ethiopia | 88.83 | 8.25 | 8.50 | 8.25 | 8.50 | 8.42 |
| Brazil | 88.83 | 8.58 | 8.42 | 8.42 | 8.50 | 8.25 |
| Peru | 88.75 | 8.42 | 8.50 | 8.33 | 8.50 | 8.25 |
| Ethiopia | 88.67 | 8.25 | 8.33 | 8.50 | 8.42 | 8.33 |
| Ethiopia | 88.42 | 8.67 | 8.67 | 8.58 | 8.42 | 8.33 |
| Ethiopia | 88.25 | 8.08 | 8.58 | 8.50 | 8.50 | 7.67 |
We have too much coffee here! We need to compress this data!
What??? Why? How? Where???
country_of_origin <chr> | total_cup_points_mean <dbl> | aroma_mean <dbl> | flavor_mean <dbl> | aftertaste_mean <dbl> | acidity_mean <dbl> | body_mean <dbl> |
|---|---|---|---|---|---|---|
| Papua New Guinea | 85.75000 | 8.330000 | 8.420000 | 7.830000 | 8.330000 | 8.000000 |
| Ethiopia | 85.48409 | 7.896364 | 8.009091 | 7.893864 | 8.043636 | 7.924091 |
| Japan | 84.67000 | 7.750000 | 7.750000 | 7.750000 | 7.420000 | 8.080000 |
| United States | 84.43300 | 7.834000 | 7.992000 | 7.850000 | 7.935000 | 7.842000 |
| Kenya | 84.30960 | 7.786800 | 7.782400 | 7.713200 | 7.866000 | 7.726400 |
Where did all that coffee go??? Why are there only 5 rows in the data? Why the names of the columns take on a surname, ’_mean`??
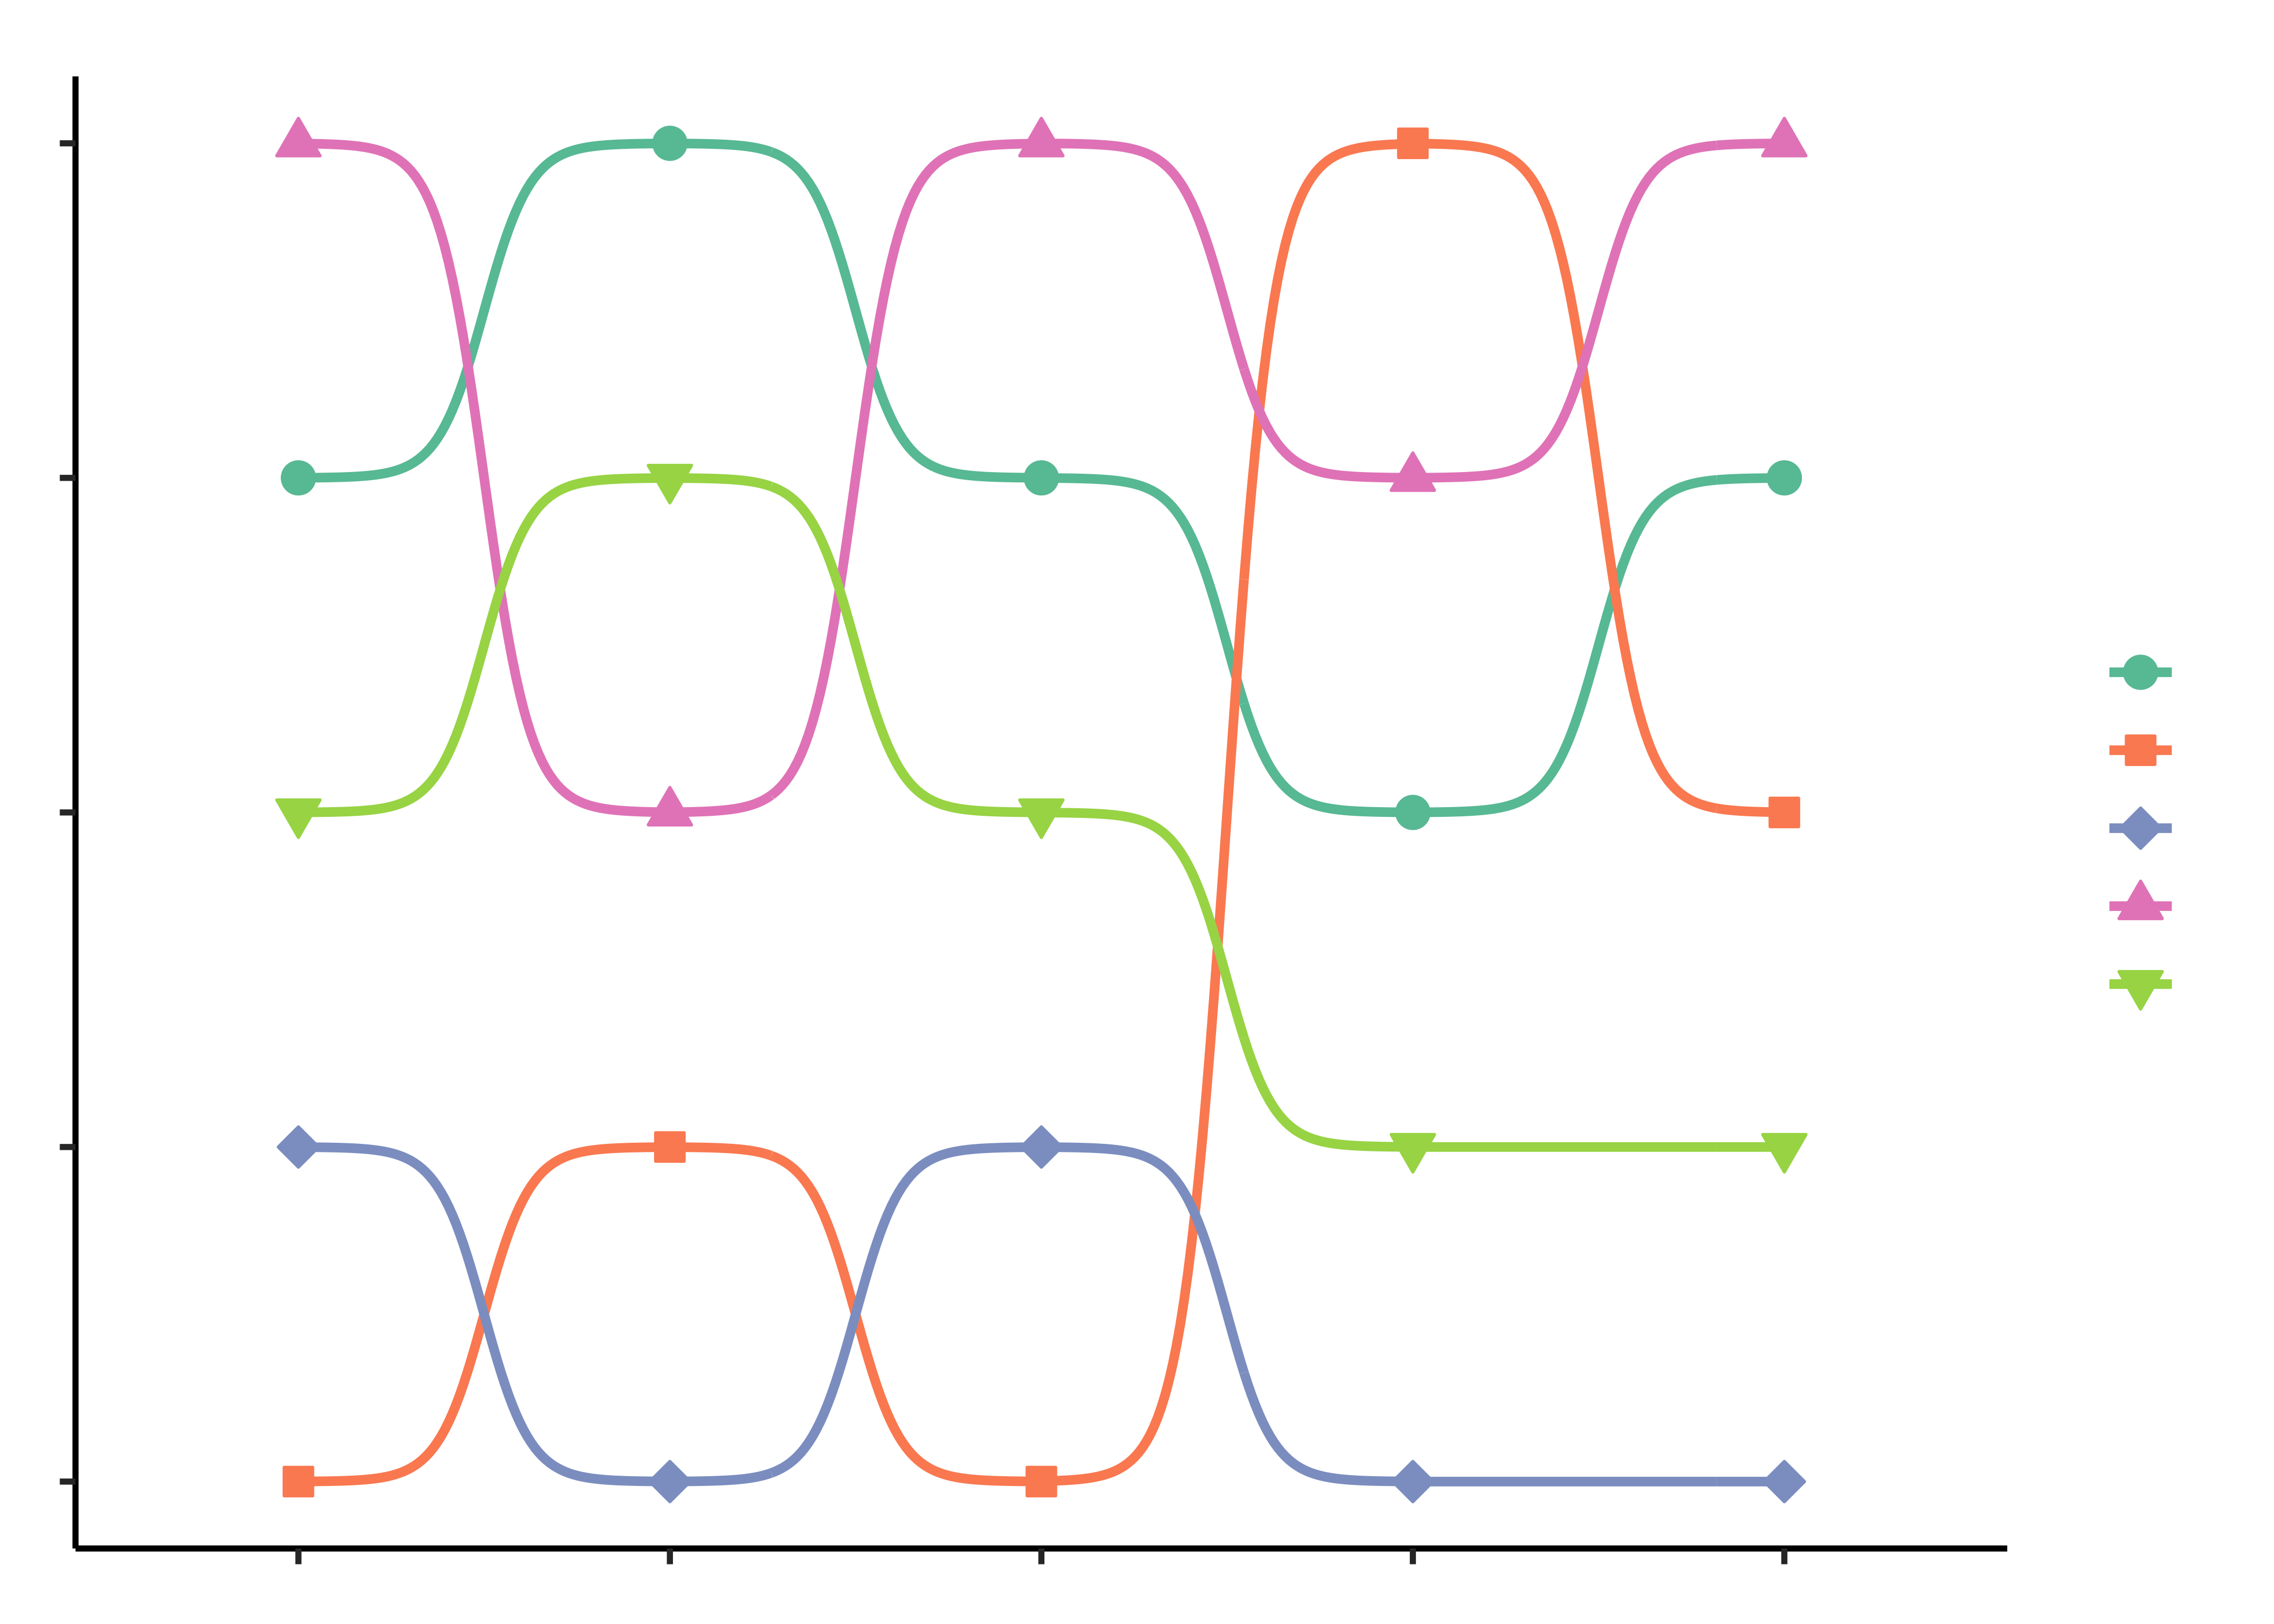
country_of_origin <chr> | total_rank <int> | aroma_rank <int> | aftertaste_rank <int> | body_rank <int> | acidity_rank <int> |
|---|---|---|---|---|---|
| Papua New Guinea | 1 | 1 | 3 | 2 | 1 |
| Ethiopia | 2 | 2 | 1 | 3 | 2 |
| Japan | 3 | 5 | 4 | 1 | 5 |
| United States | 4 | 3 | 2 | 4 | 3 |
| Kenya | 5 | 4 | 5 | 5 | 4 |
What just happened? How did we convert those mean numbers to ranks?
country_of_origin <chr> | coffee_parameter <chr> | ranks <int> | ||
|---|---|---|---|---|
| Papua New Guinea | acidity_rank | 1 | ||
| Ethiopia | acidity_rank | 2 | ||
| Japan | acidity_rank | 5 | ||
| United States | acidity_rank | 3 | ||
| Kenya | acidity_rank | 4 | ||
| Papua New Guinea | aftertaste_rank | 3 | ||
| Ethiopia | aftertaste_rank | 1 | ||
| Japan | aftertaste_rank | 4 | ||
| United States | aftertaste_rank | 2 | ||
| Kenya | aftertaste_rank | 5 |
Plot the Data
Discussion
Complete the Data Dictionary. Select and Transform the variables as shown. Create the graphs shown below and discuss the following questions:
- Identify the type of charts
- Identify the variables used for various geometrical aspects (x, y, fill…). Name the variables appropriately.
- What research activity might have been carried out to obtain the data graphed here? Provide some details.
- What might have been the Hypothesis/Research Question to which the response was Chart?
- Write a 2-line story based on the chart, describing your inference/surprise.