Applied Metaphors: Learning TRIZ, Complexity, Data/Stats/ML using Metaphors
  1. Teaching
  2. Data Analytics for Managers and Creators
  3. Case Studies
  4. William Farr’s Observations on Cholera in London
  • Teaching
    • Data Analytics for Managers and Creators
      • Tools
        • Introduction to R and RStudio
        • Introduction to Radiant
        • Introduction to Orange
      • Descriptive Analytics
        • Data
        • Summaries
        • Counts
        • Quantities
        • Groups
        • Densities
        • Groups and Densities
        • Change
        • Proportions
        • Parts of a Whole
        • Evolution and Flow
        • Ratings and Rankings
        • Surveys
        • Time
        • Space
        • Networks
        • Experiments
        • Miscellaneous Graphing Tools, and References
      • Statistical Inference
        • 🧭 Basics of Statistical Inference
        • 🎲 Samples, Populations, Statistics and Inference
        • Basics of Randomization Tests
        • 🃏 Inference for a Single Mean
        • 🃏 Inference for Two Independent Means
        • 🃏 Inference for Comparing Two Paired Means
        • Comparing Multiple Means with ANOVA
        • Inference for Correlation
        • 🃏 Testing a Single Proportion
        • 🃏 Inference Test for Two Proportions
      • Inferential Modelling
        • Modelling with Linear Regression
        • Modelling with Logistic Regression
        • 🕔 Modelling and Predicting Time Series
      • Predictive Modelling
        • 🐉 Intro to Orange
        • ML - Regression
        • ML - Classification
        • ML - Clustering
      • Prescriptive Modelling
        • 📐 Intro to Linear Programming
        • 💭 The Simplex Method - Intuitively
        • 📅 The Simplex Method - In Excel
      • Workflow
        • Facing the Abyss
        • I Publish, therefore I Am
      • Case Studies
        • Demo:Product Packaging and Elderly People
        • Ikea Furniture
        • Movie Profits
        • Gender at the Work Place
        • Heptathlon
        • School Scores
        • Children's Games
        • Valentine’s Day Spending
        • Women Live Longer?
        • Hearing Loss in Children
        • California Transit Payments
        • Seaweed Nutrients
        • Coffee Flavours
        • Legionnaire’s Disease in the USA
        • Antarctic Sea ice
        • William Farr's Observations on Cholera in London
    • R for Artists and Managers
      • 🕶 Lab-1: Science, Human Experience, Experiments, and Data
      • Lab-2: Down the R-abbit Hole…
      • Lab-3: Drink Me!
      • Lab-4: I say what I mean and I mean what I say
      • Lab-5: Twas brillig, and the slithy toves…
      • Lab-6: These Roses have been Painted !!
      • Lab-7: The Lobster Quadrille
      • Lab-8: Did you ever see such a thing as a drawing of a muchness?
      • Lab-9: If you please sir…which way to the Secret Garden?
      • Lab-10: An Invitation from the Queen…to play Croquet
      • Lab-11: The Queen of Hearts, She Made some Tarts
      • Lab-12: Time is a Him!!
      • Iteration: Learning to purrr
      • Lab-13: Old Tortoise Taught Us
      • Lab-14: You’re are Nothing but a Pack of Cards!!
    • ML for Artists and Managers
      • 🐉 Intro to Orange
      • ML - Regression
      • ML - Classification
      • ML - Clustering
      • 🕔 Modelling Time Series
    • TRIZ for Problem Solvers
      • I am Water
      • I am What I yam
      • Birds of Different Feathers
      • I Connect therefore I am
      • I Think, Therefore I am
      • The Art of Parallel Thinking
      • A Year of Metaphoric Thinking
      • TRIZ - Problems and Contradictions
      • TRIZ - The Unreasonable Effectiveness of Available Resources
      • TRIZ - The Ideal Final Result
      • TRIZ - A Contradictory Language
      • TRIZ - The Contradiction Matrix Workflow
      • TRIZ - The Laws of Evolution
      • TRIZ - Substance Field Analysis, and ARIZ
    • Math Models for Creative Coders
      • Maths Basics
        • Vectors
        • Matrix Algebra Whirlwind Tour
        • content/courses/MathModelsDesign/Modules/05-Maths/70-MultiDimensionGeometry/index.qmd
      • Tech
        • Tools and Installation
        • Adding Libraries to p5.js
        • Using Constructor Objects in p5.js
      • Geometry
        • Circles
        • Complex Numbers
        • Fractals
        • Affine Transformation Fractals
        • L-Systems
        • Kolams and Lusona
      • Media
        • Fourier Series
        • Additive Sound Synthesis
        • Making Noise Predictably
        • The Karplus-Strong Guitar Algorithm
      • AI
        • Working with Neural Nets
        • The Perceptron
        • The Multilayer Perceptron
        • MLPs and Backpropagation
        • Gradient Descent
      • Projects
        • Projects
    • Data Science with No Code
      • Data
      • Orange
      • Summaries
      • Counts
      • Quantity
      • 🕶 Happy Data are all Alike
      • Groups
      • Change
      • Rhythm
      • Proportions
      • Flow
      • Structure
      • Ranking
      • Space
      • Time
      • Networks
      • Surveys
      • Experiments
    • Tech for Creative Education
      • 🧭 Using Idyll
      • 🧭 Using Apparatus
      • 🧭 Using g9.js
    • Literary Jukebox: In Short, the World
      • Italy - Dino Buzzati
      • France - Guy de Maupassant
      • Japan - Hisaye Yamamoto
      • Peru - Ventura Garcia Calderon
      • Russia - Maxim Gorky
      • Egypt - Alifa Rifaat
      • Brazil - Clarice Lispector
      • England - V S Pritchett
      • Russia - Ivan Bunin
      • Czechia - Milan Kundera
      • Sweden - Lars Gustaffsson
      • Canada - John Cheever
      • Ireland - William Trevor
      • USA - Raymond Carver
      • Italy - Primo Levi
      • India - Ruth Prawer Jhabvala
      • USA - Carson McCullers
      • Zimbabwe - Petina Gappah
      • India - Bharati Mukherjee
      • USA - Lucia Berlin
      • USA - Grace Paley
      • England - Angela Carter
      • USA - Kurt Vonnegut
      • Spain-Merce Rodoreda
      • Israel - Ruth Calderon
      • Israel - Etgar Keret
  • Posts
  • Blogs and Talks

On this page

  • Setting up R Packages
  • Introduction
  • Read the Data
  • Data Dictionary
  • Research Question
  • Analyse/Transform the Data
  • Plot the Data
  • Tasks and Discussion
  1. Teaching
  2. Data Analytics for Managers and Creators
  3. Case Studies
  4. William Farr’s Observations on Cholera in London

William Farr’s Observations on Cholera in London

Setting up R Packages

library(tidyverse)
library(mosaic)
library(skimr)
library(ggformula)
library(GGally)

Introduction

John Snow’s contention that cholera was principally spread by water was not accepted in the 1850s by the medical elite. The consequence of rejection was that hundreds in the UK continued to die. William Farr, who founded the science of epidemiology, tried to examine if there were other causes that led to cholera. He had concluded that the available data not only supported miasma (spread via atmospheric vapours) but also indicated that there was an underlying ‘natural law’ linking infection with cholera inversely to elevation above high water. The data is available on Vincent Arel-Bundock’s website, and is part of the HistData package from Michael Friendly, UC Davis.

Read the Data

Cholera <- read_csv("https://vincentarelbundock.github.io/Rdatasets/csv/HistData/Cholera.csv")
Cholera
ABCDEFGHIJ0123456789
rownames
<dbl>
district
<chr>
cholera_drate
<dbl>
cholera_deaths
<dbl>
popn
<dbl>
elevation
<dbl>
region
<chr>
1Newington14490763074-2Kent
2Rotherhithe205352172080Kent
3Bermondsey164836509000Kent
4St George Southwark161734455000Kent
5St Olave181349192782Kent
6St Saviour153539352272Kent
7Westminster68437641092West
8Lambeth12016181347683Kent
9Camberwell97504517044Kent
10Greenwich75718959548Kent
Next
1234
Previous
1-10 of 38 rows | 1-7 of 16 columns

Data Dictionary

NoteQuantitative Variables

Write in.

NoteQualitative Variables

Write in.

NoteObservations

Write in.

Research Question

Note

Write in! Look at the charts below!

Analyse/Transform the Data

```{r}
#| label: data-preprocessing
#
# Write in your code here
# to prepare this data as shown below
# to generate the plot that follows
```

Plot the Data

Tasks and Discussion

  • Complete the Data Dictionary.
  • Select and Transform the variables as needed.
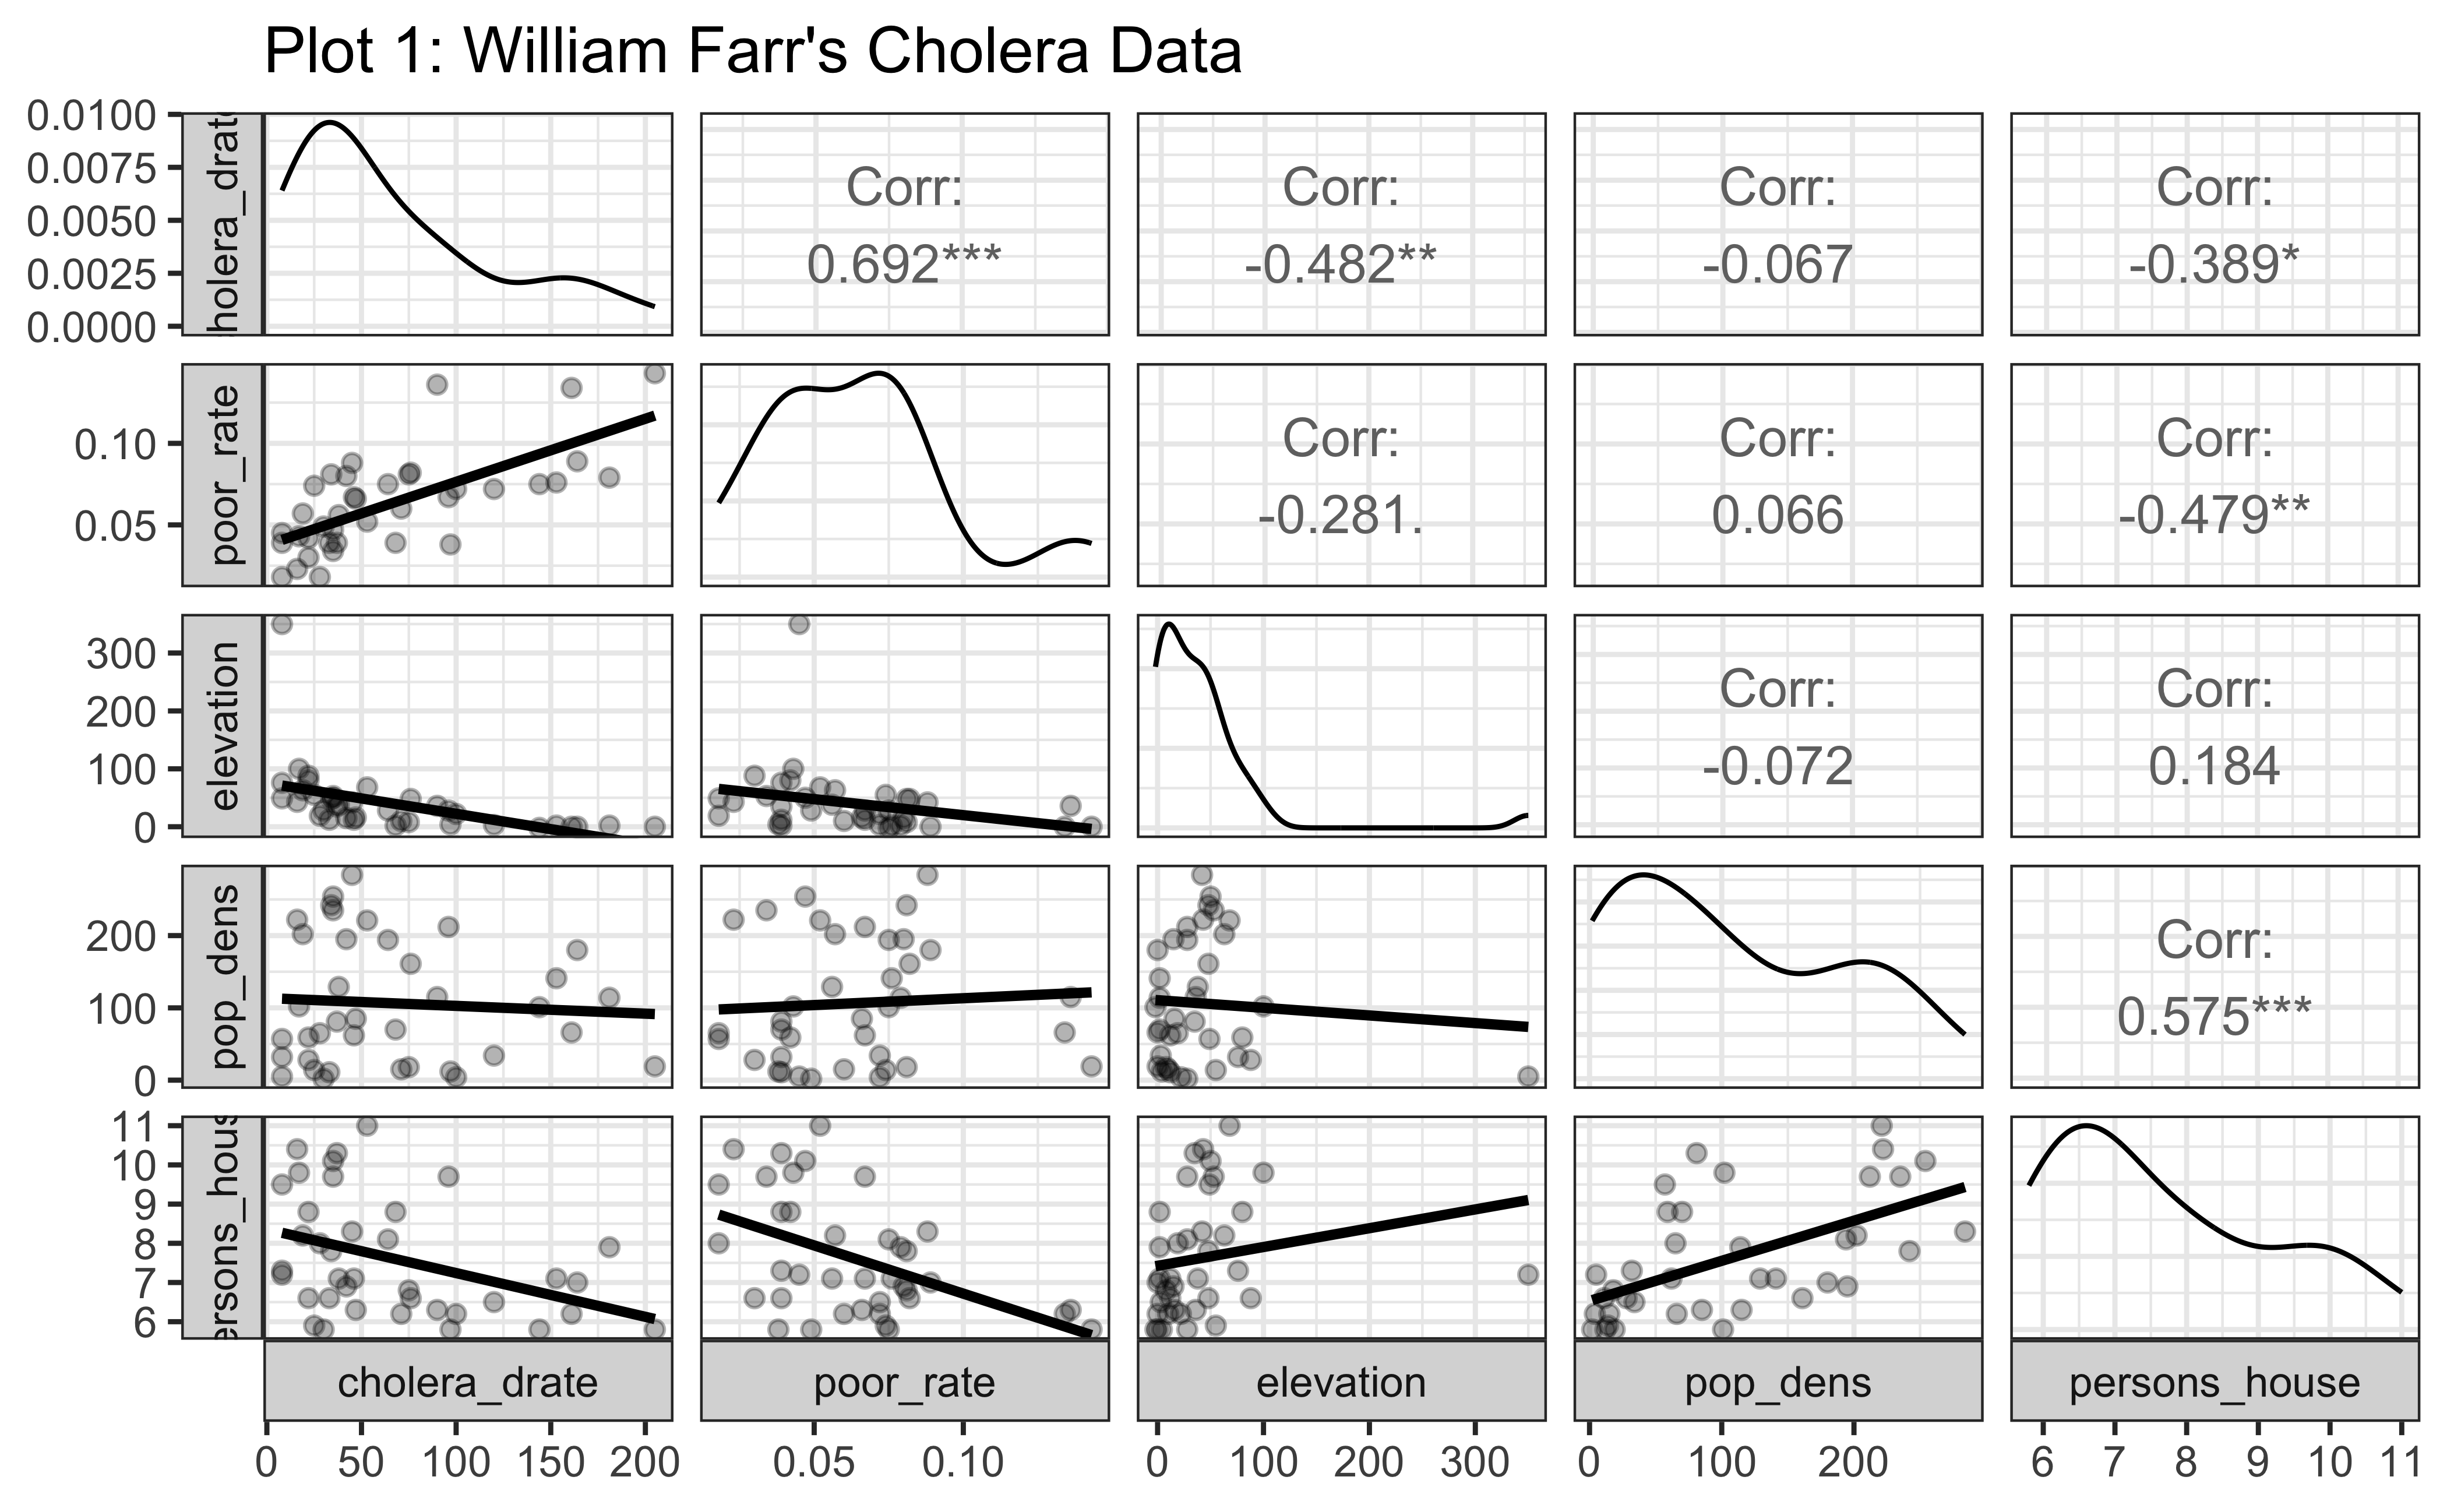
  • Look at Plot 1. Would you agree based on this chart that William Farr was right in believing that elevation was a good predictor for cholera deaths? Justify.
  • What is the nature of the relationship between Cholera Deaths and Elevation?
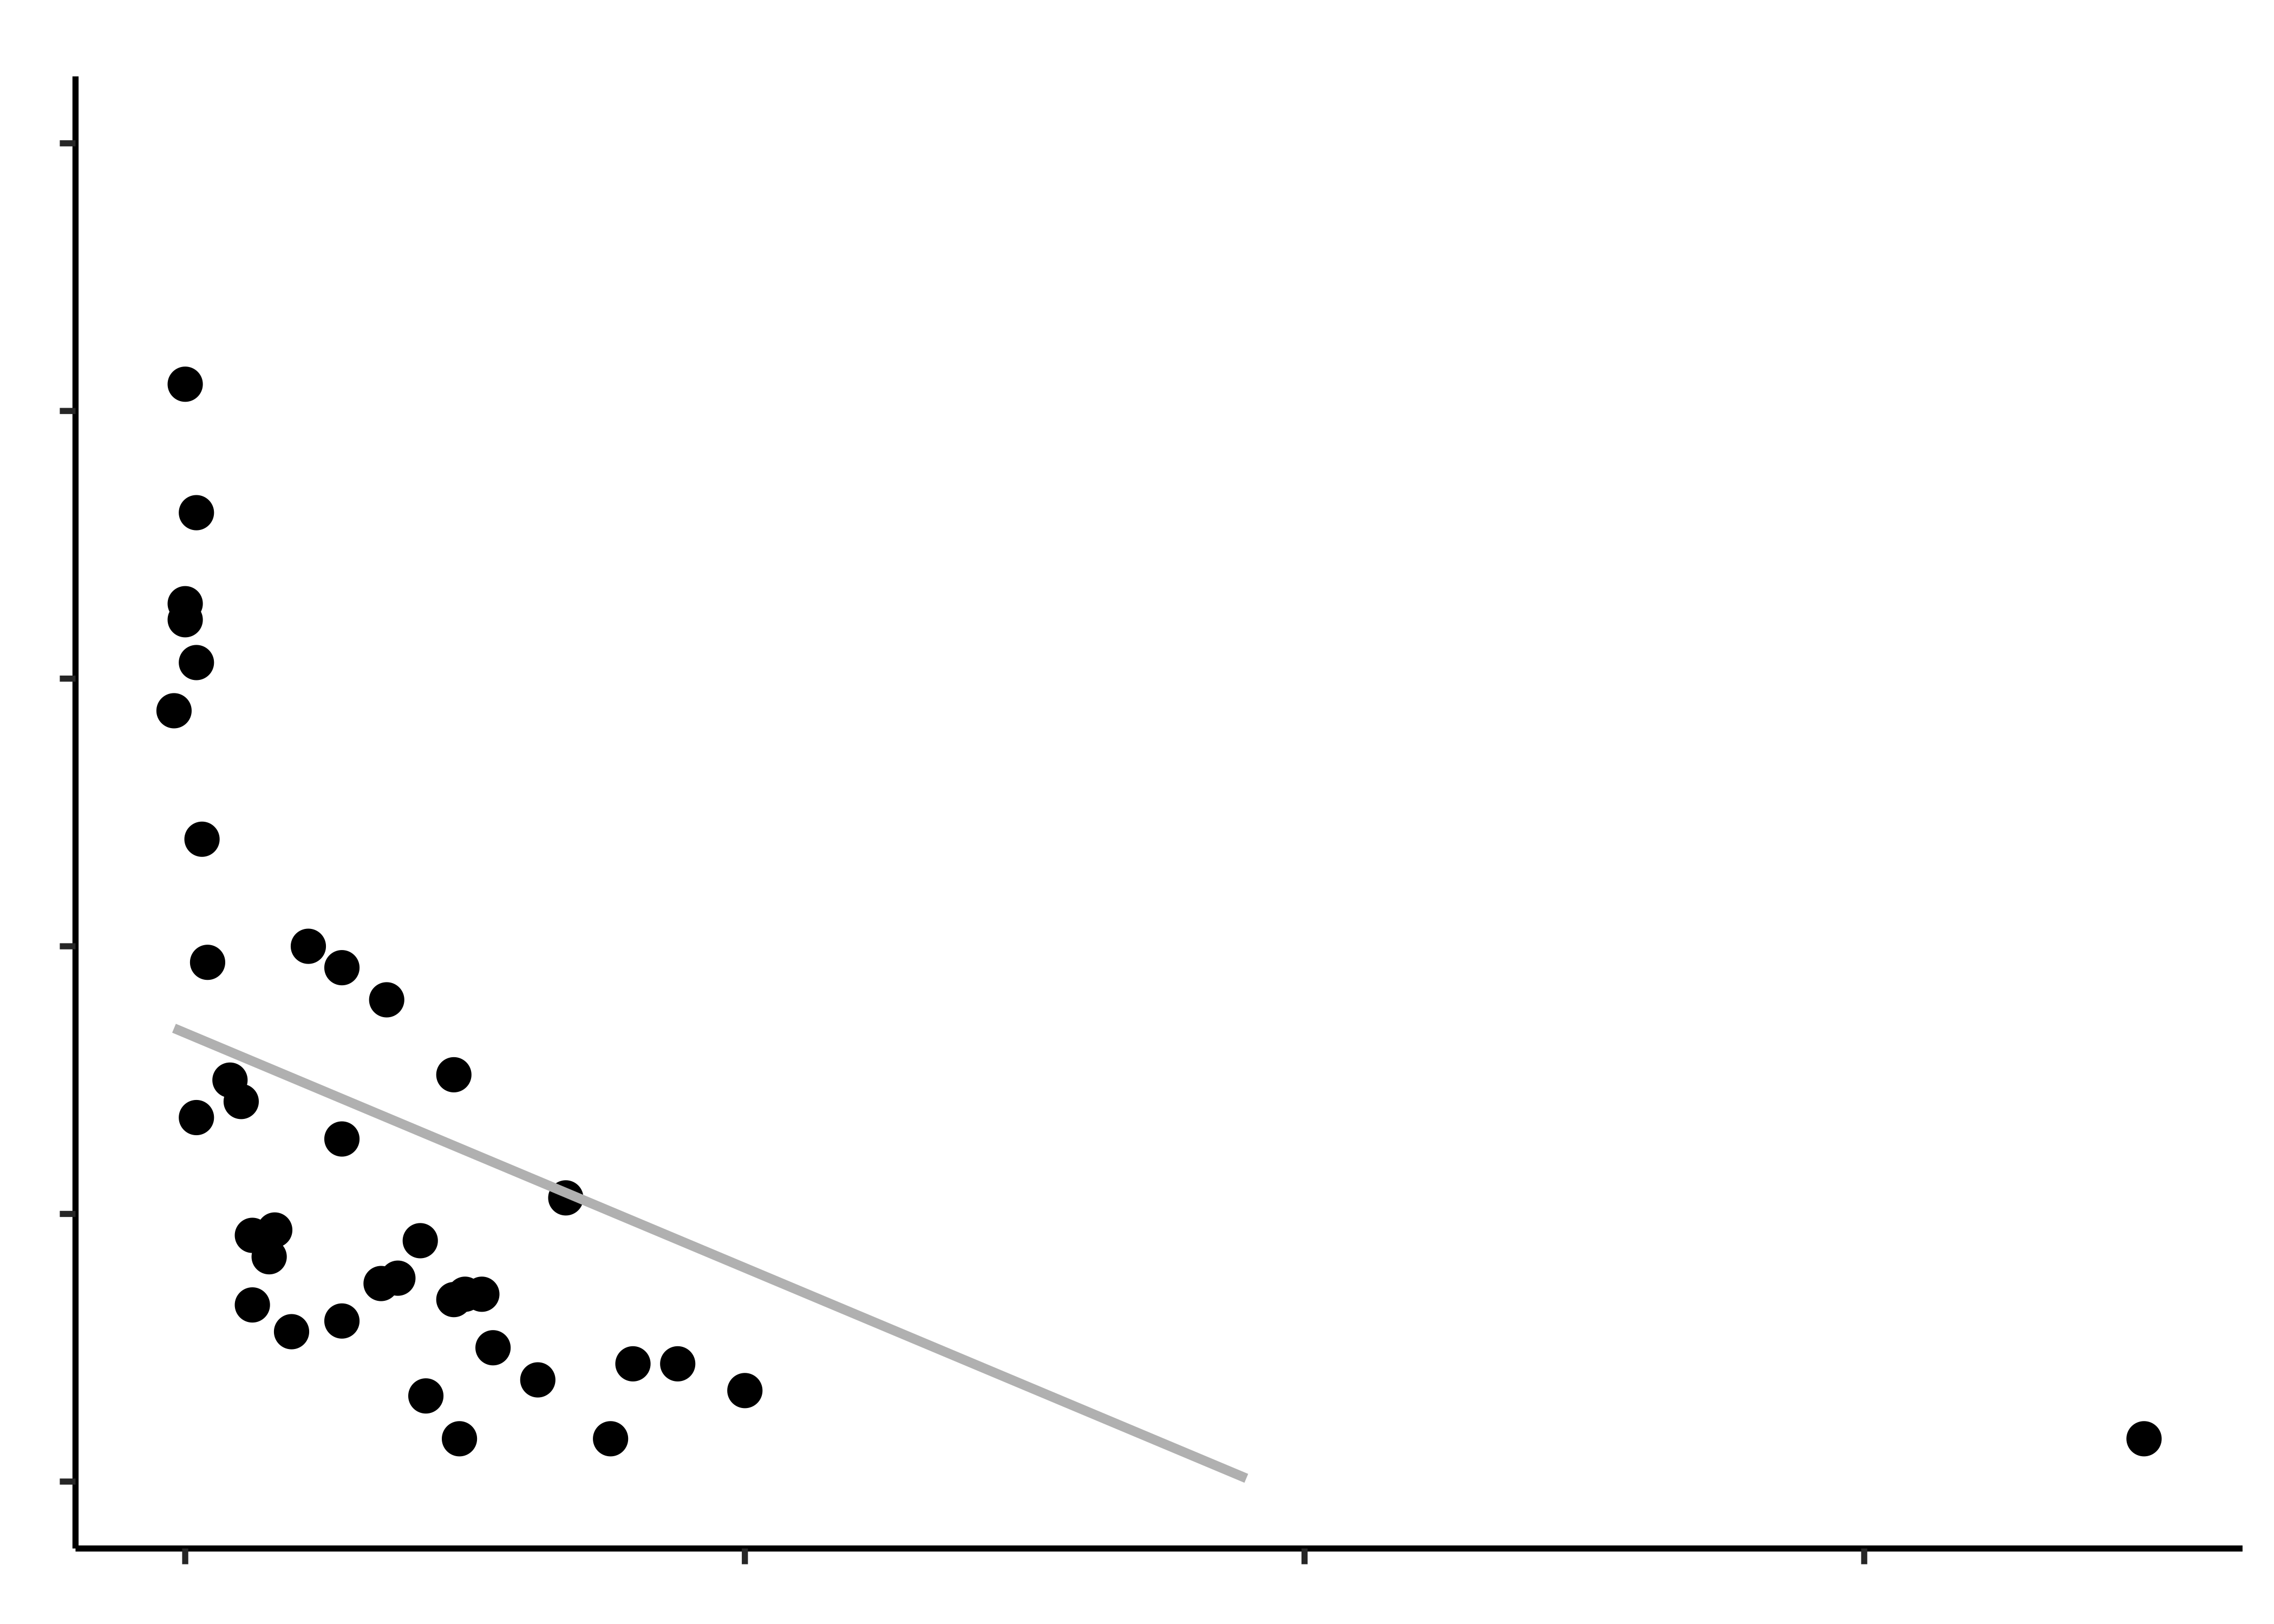
  • Look at Plot 2. What kind of plot is it? What is the relationship here between Elevation and Cholera Death Rate?
  • Based on this graph, would you agree that Elevation is a predictor for Cholera Deaths? Justify.
  • Is the relationship you found between Cholera Deaths and Elevation also found in Plot 1? Justify.
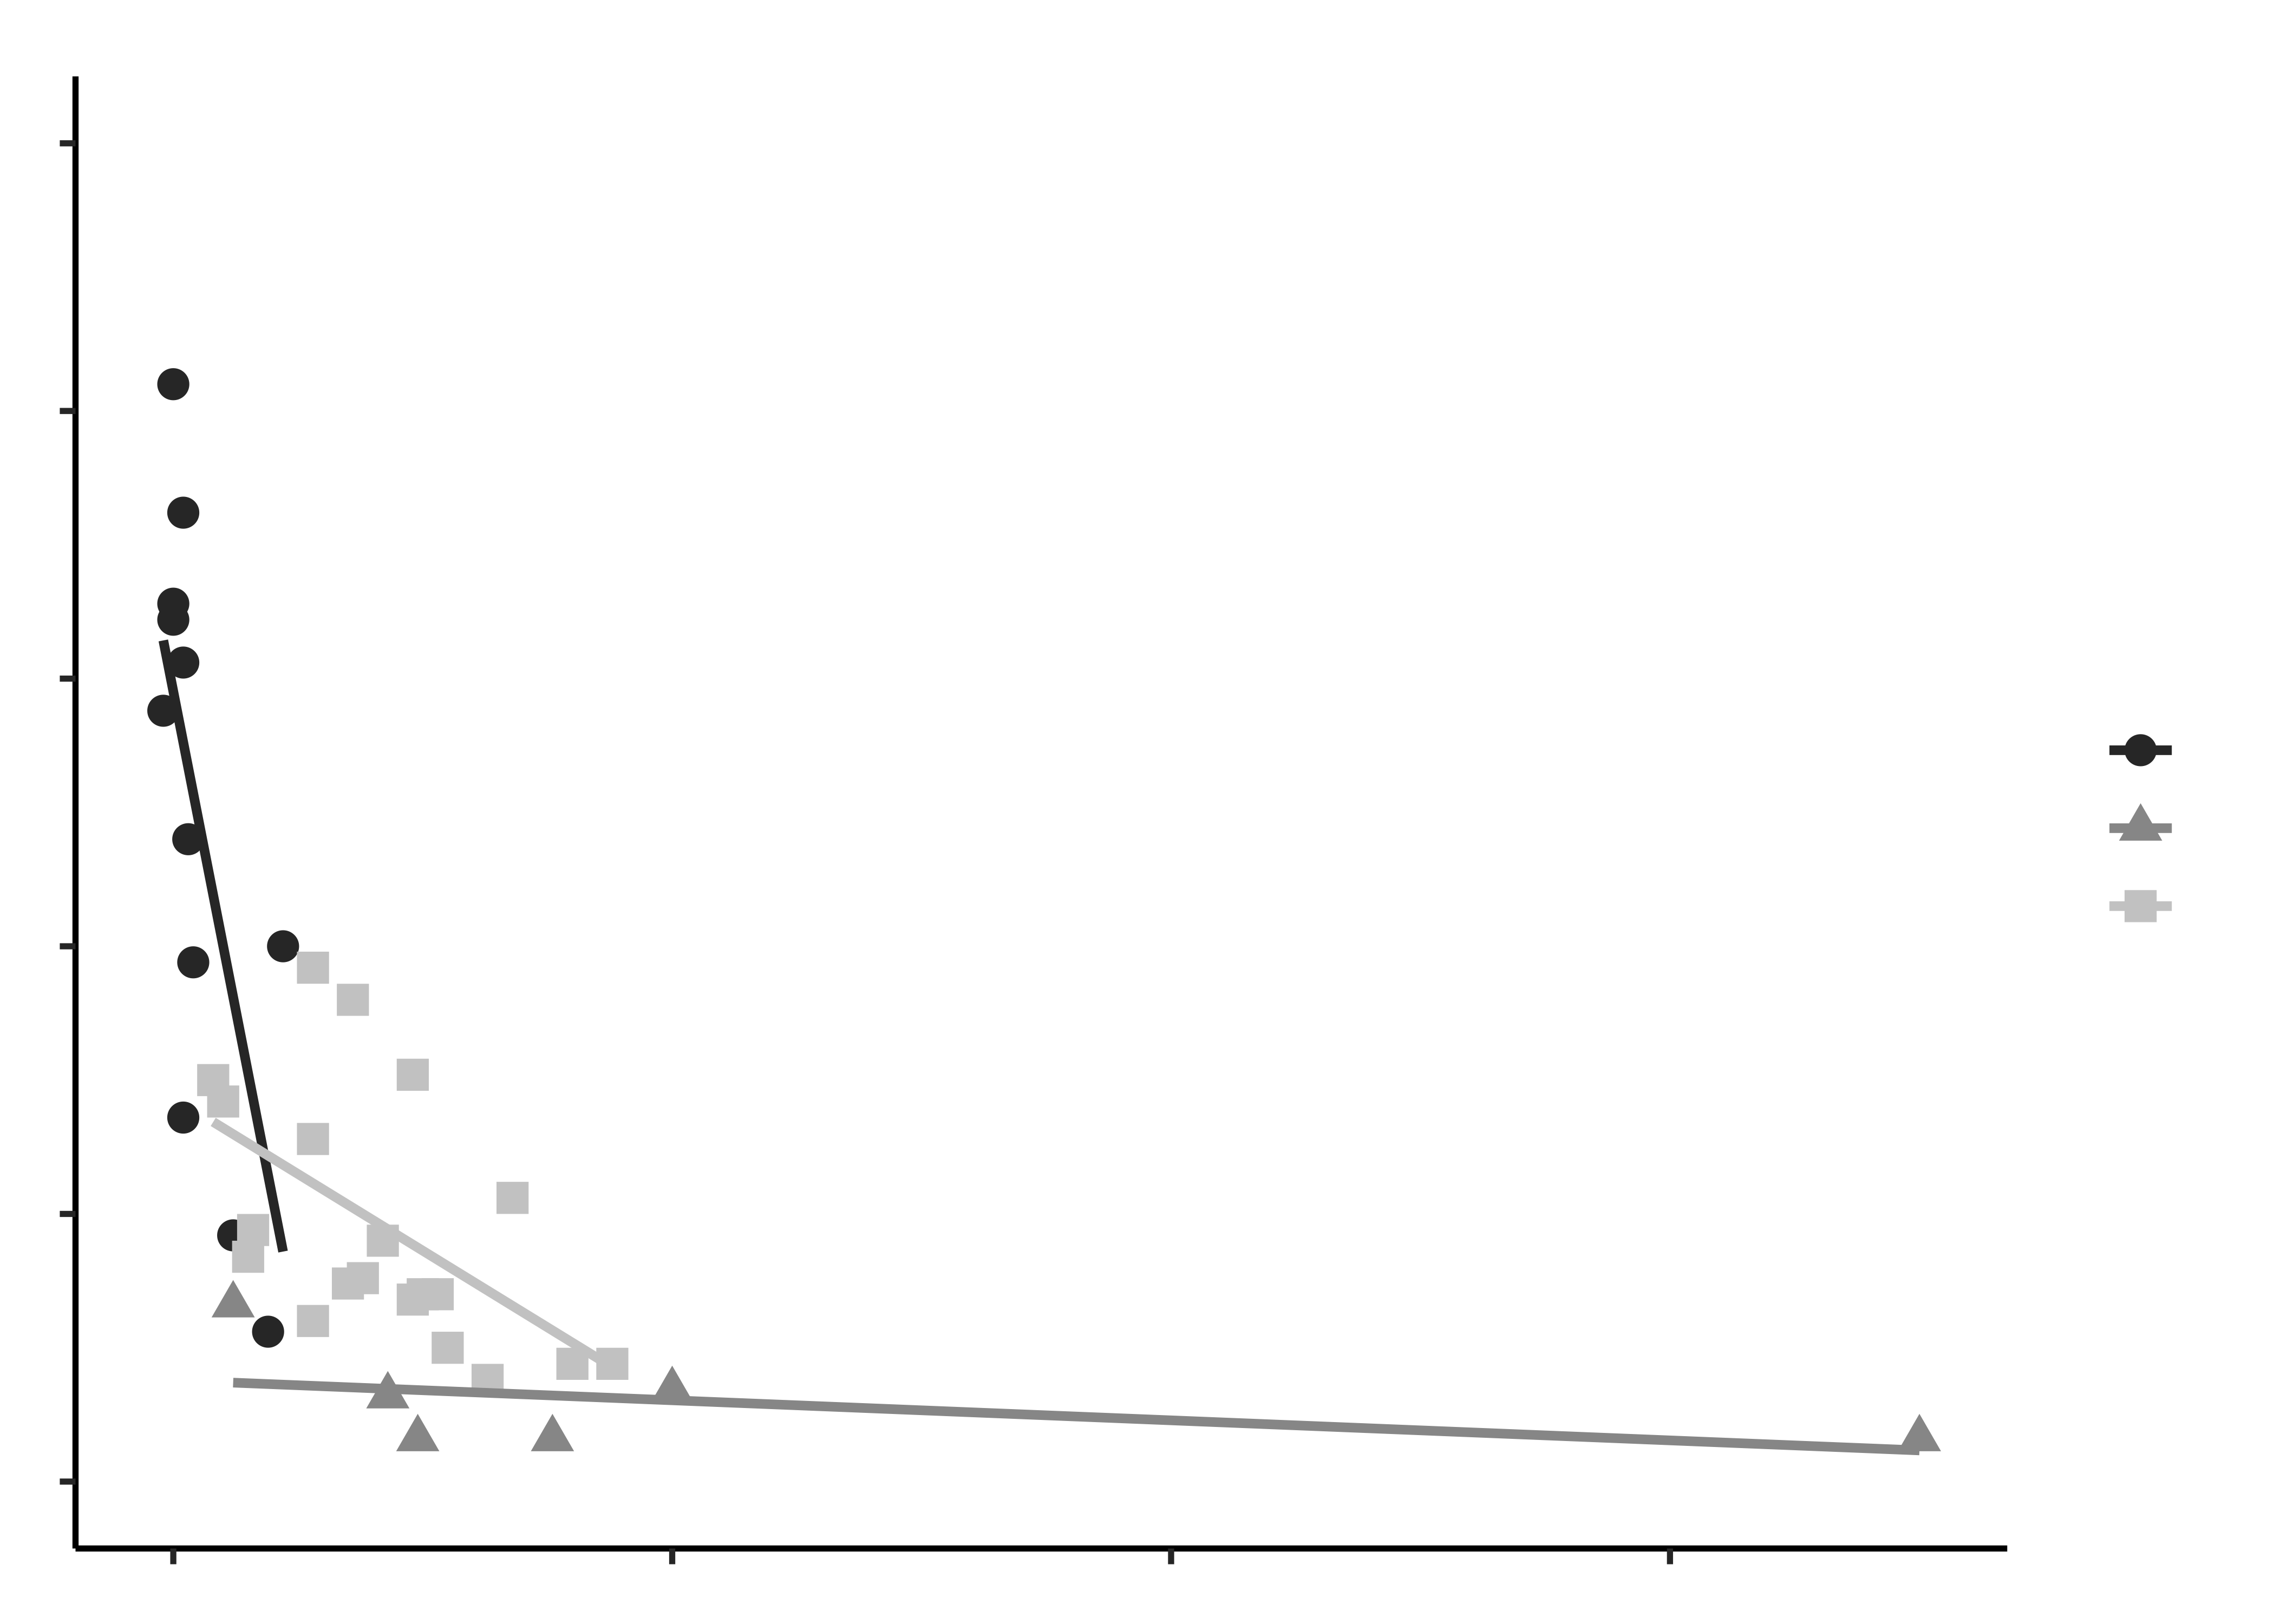
  • Look at Plot 3. Would you guess that there could be another predictor for Cholera Deaths? What could that Predictor be? Justify.
Back to top
Antarctic Sea ice
R for Artists and Managers

License: CC BY-SA 2.0

Website made with ❤️ and Quarto, by Arvind V.

Hosted by Netlify .