Applied Metaphors: Learning TRIZ, Complexity, Data/Stats/ML using Metaphors
  1. New York Dog Bites
  • Teaching
    • Data Analytics for Managers and Creators
      • Tools
        • Introduction to R and RStudio
        • Introduction to Radiant
        • Introduction to Orange
      • Descriptive Analytics
        • Data
        • Summaries
        • Counts
        • Quantities
        • Groups
        • Densities
        • Groups and Densities
        • Change
        • Proportions
        • Parts of a Whole
        • Evolution and Flow
        • Ratings and Rankings
        • Surveys
        • Time
        • Space
        • Networks
        • Experiments
        • Miscellaneous Graphing Tools, and References
      • Statistical Inference
        • 🧭 Basics of Statistical Inference
        • 🎲 Samples, Populations, Statistics and Inference
        • Basics of Randomization Tests
        • 🃏 Inference for a Single Mean
        • 🃏 Inference for Two Independent Means
        • 🃏 Inference for Comparing Two Paired Means
        • Comparing Multiple Means with ANOVA
        • Inference for Correlation
        • 🃏 Testing a Single Proportion
        • 🃏 Inference Test for Two Proportions
      • Inferential Modelling
        • Modelling with Linear Regression
        • Modelling with Logistic Regression
        • 🕔 Modelling and Predicting Time Series
      • Predictive Modelling
        • 🐉 Intro to Orange
        • ML - Regression
        • ML - Classification
        • ML - Clustering
      • Prescriptive Modelling
        • 📐 Intro to Linear Programming
        • 💭 The Simplex Method - Intuitively
        • 📅 The Simplex Method - In Excel
      • Workflow
        • Facing the Abyss
        • I Publish, therefore I Am
      • Case Studies
        • Demo:Product Packaging and Elderly People
        • Ikea Furniture
        • Movie Profits
        • Gender at the Work Place
        • Heptathlon
        • School Scores
        • Children's Games
        • Valentine’s Day Spending
        • Women Live Longer?
        • Hearing Loss in Children
        • California Transit Payments
        • Seaweed Nutrients
        • Coffee Flavours
        • Legionnaire’s Disease in the USA
        • Antarctic Sea ice
        • William Farr's Observations on Cholera in London
    • R for Artists and Managers
      • 🕶 Lab-1: Science, Human Experience, Experiments, and Data
      • Lab-2: Down the R-abbit Hole…
      • Lab-3: Drink Me!
      • Lab-4: I say what I mean and I mean what I say
      • Lab-5: Twas brillig, and the slithy toves…
      • Lab-6: These Roses have been Painted !!
      • Lab-7: The Lobster Quadrille
      • Lab-8: Did you ever see such a thing as a drawing of a muchness?
      • Lab-9: If you please sir…which way to the Secret Garden?
      • Lab-10: An Invitation from the Queen…to play Croquet
      • Lab-11: The Queen of Hearts, She Made some Tarts
      • Lab-12: Time is a Him!!
      • Iteration: Learning to purrr
      • Lab-13: Old Tortoise Taught Us
      • Lab-14: You’re are Nothing but a Pack of Cards!!
    • ML for Artists and Managers
      • 🐉 Intro to Orange
      • ML - Regression
      • ML - Classification
      • ML - Clustering
      • 🕔 Modelling Time Series
    • TRIZ for Problem Solvers
      • I am Water
      • I am What I yam
      • Birds of Different Feathers
      • I Connect therefore I am
      • I Think, Therefore I am
      • The Art of Parallel Thinking
      • A Year of Metaphoric Thinking
      • TRIZ - Problems and Contradictions
      • TRIZ - The Unreasonable Effectiveness of Available Resources
      • TRIZ - The Ideal Final Result
      • TRIZ - A Contradictory Language
      • TRIZ - The Contradiction Matrix Workflow
      • TRIZ - The Laws of Evolution
      • TRIZ - Substance Field Analysis, and ARIZ
    • Math Models for Creative Coders
      • Maths Basics
        • Vectors
        • Matrix Algebra Whirlwind Tour
        • content/courses/MathModelsDesign/Modules/05-Maths/70-MultiDimensionGeometry/index.qmd
      • Tech
        • Tools and Installation
        • Adding Libraries to p5.js
        • Using Constructor Objects in p5.js
      • Geometry
        • Circles
        • Complex Numbers
        • Fractals
        • Affine Transformation Fractals
        • L-Systems
        • Kolams and Lusona
      • Media
        • Fourier Series
        • Additive Sound Synthesis
        • Making Noise Predictably
        • The Karplus-Strong Guitar Algorithm
      • AI
        • Working with Neural Nets
        • The Perceptron
        • The Multilayer Perceptron
        • MLPs and Backpropagation
        • Gradient Descent
      • Projects
        • Projects
    • Data Science with No Code
      • Data
      • Orange
      • Summaries
      • Counts
      • Quantity
      • 🕶 Happy Data are all Alike
      • Groups
      • Change
      • Rhythm
      • Proportions
      • Flow
      • Structure
      • Ranking
      • Space
      • Time
      • Networks
      • Surveys
      • Experiments
    • Tech for Creative Education
      • 🧭 Using Idyll
      • 🧭 Using Apparatus
      • 🧭 Using g9.js
    • Literary Jukebox: In Short, the World
      • Italy - Dino Buzzati
      • France - Guy de Maupassant
      • Japan - Hisaye Yamamoto
      • Peru - Ventura Garcia Calderon
      • Russia - Maxim Gorky
      • Egypt - Alifa Rifaat
      • Brazil - Clarice Lispector
      • England - V S Pritchett
      • Russia - Ivan Bunin
      • Czechia - Milan Kundera
      • Sweden - Lars Gustaffsson
      • Canada - John Cheever
      • Ireland - William Trevor
      • USA - Raymond Carver
      • Italy - Primo Levi
      • India - Ruth Prawer Jhabvala
      • USA - Carson McCullers
      • Zimbabwe - Petina Gappah
      • India - Bharati Mukherjee
      • USA - Lucia Berlin
      • USA - Grace Paley
      • England - Angela Carter
      • USA - Kurt Vonnegut
      • Spain-Merce Rodoreda
      • Israel - Ruth Calderon
      • Israel - Etgar Keret
  • Posts
  • Blogs and Talks

On this page

  • Setting up R Packages
  • Introduction
  • Read the Data
  • Inspect the Data
  • Data Dictionary
  • Research Question
  • Analyse/Transform the Data
  • Plot the Data
  • Tasks and Discussion

New York Dog Bites

Setting up R Packages

library(tidyverse)
library(mosaic)
library(skimr)
library(ggformula)
library(ggbump)
library(ggprism)

Introduction

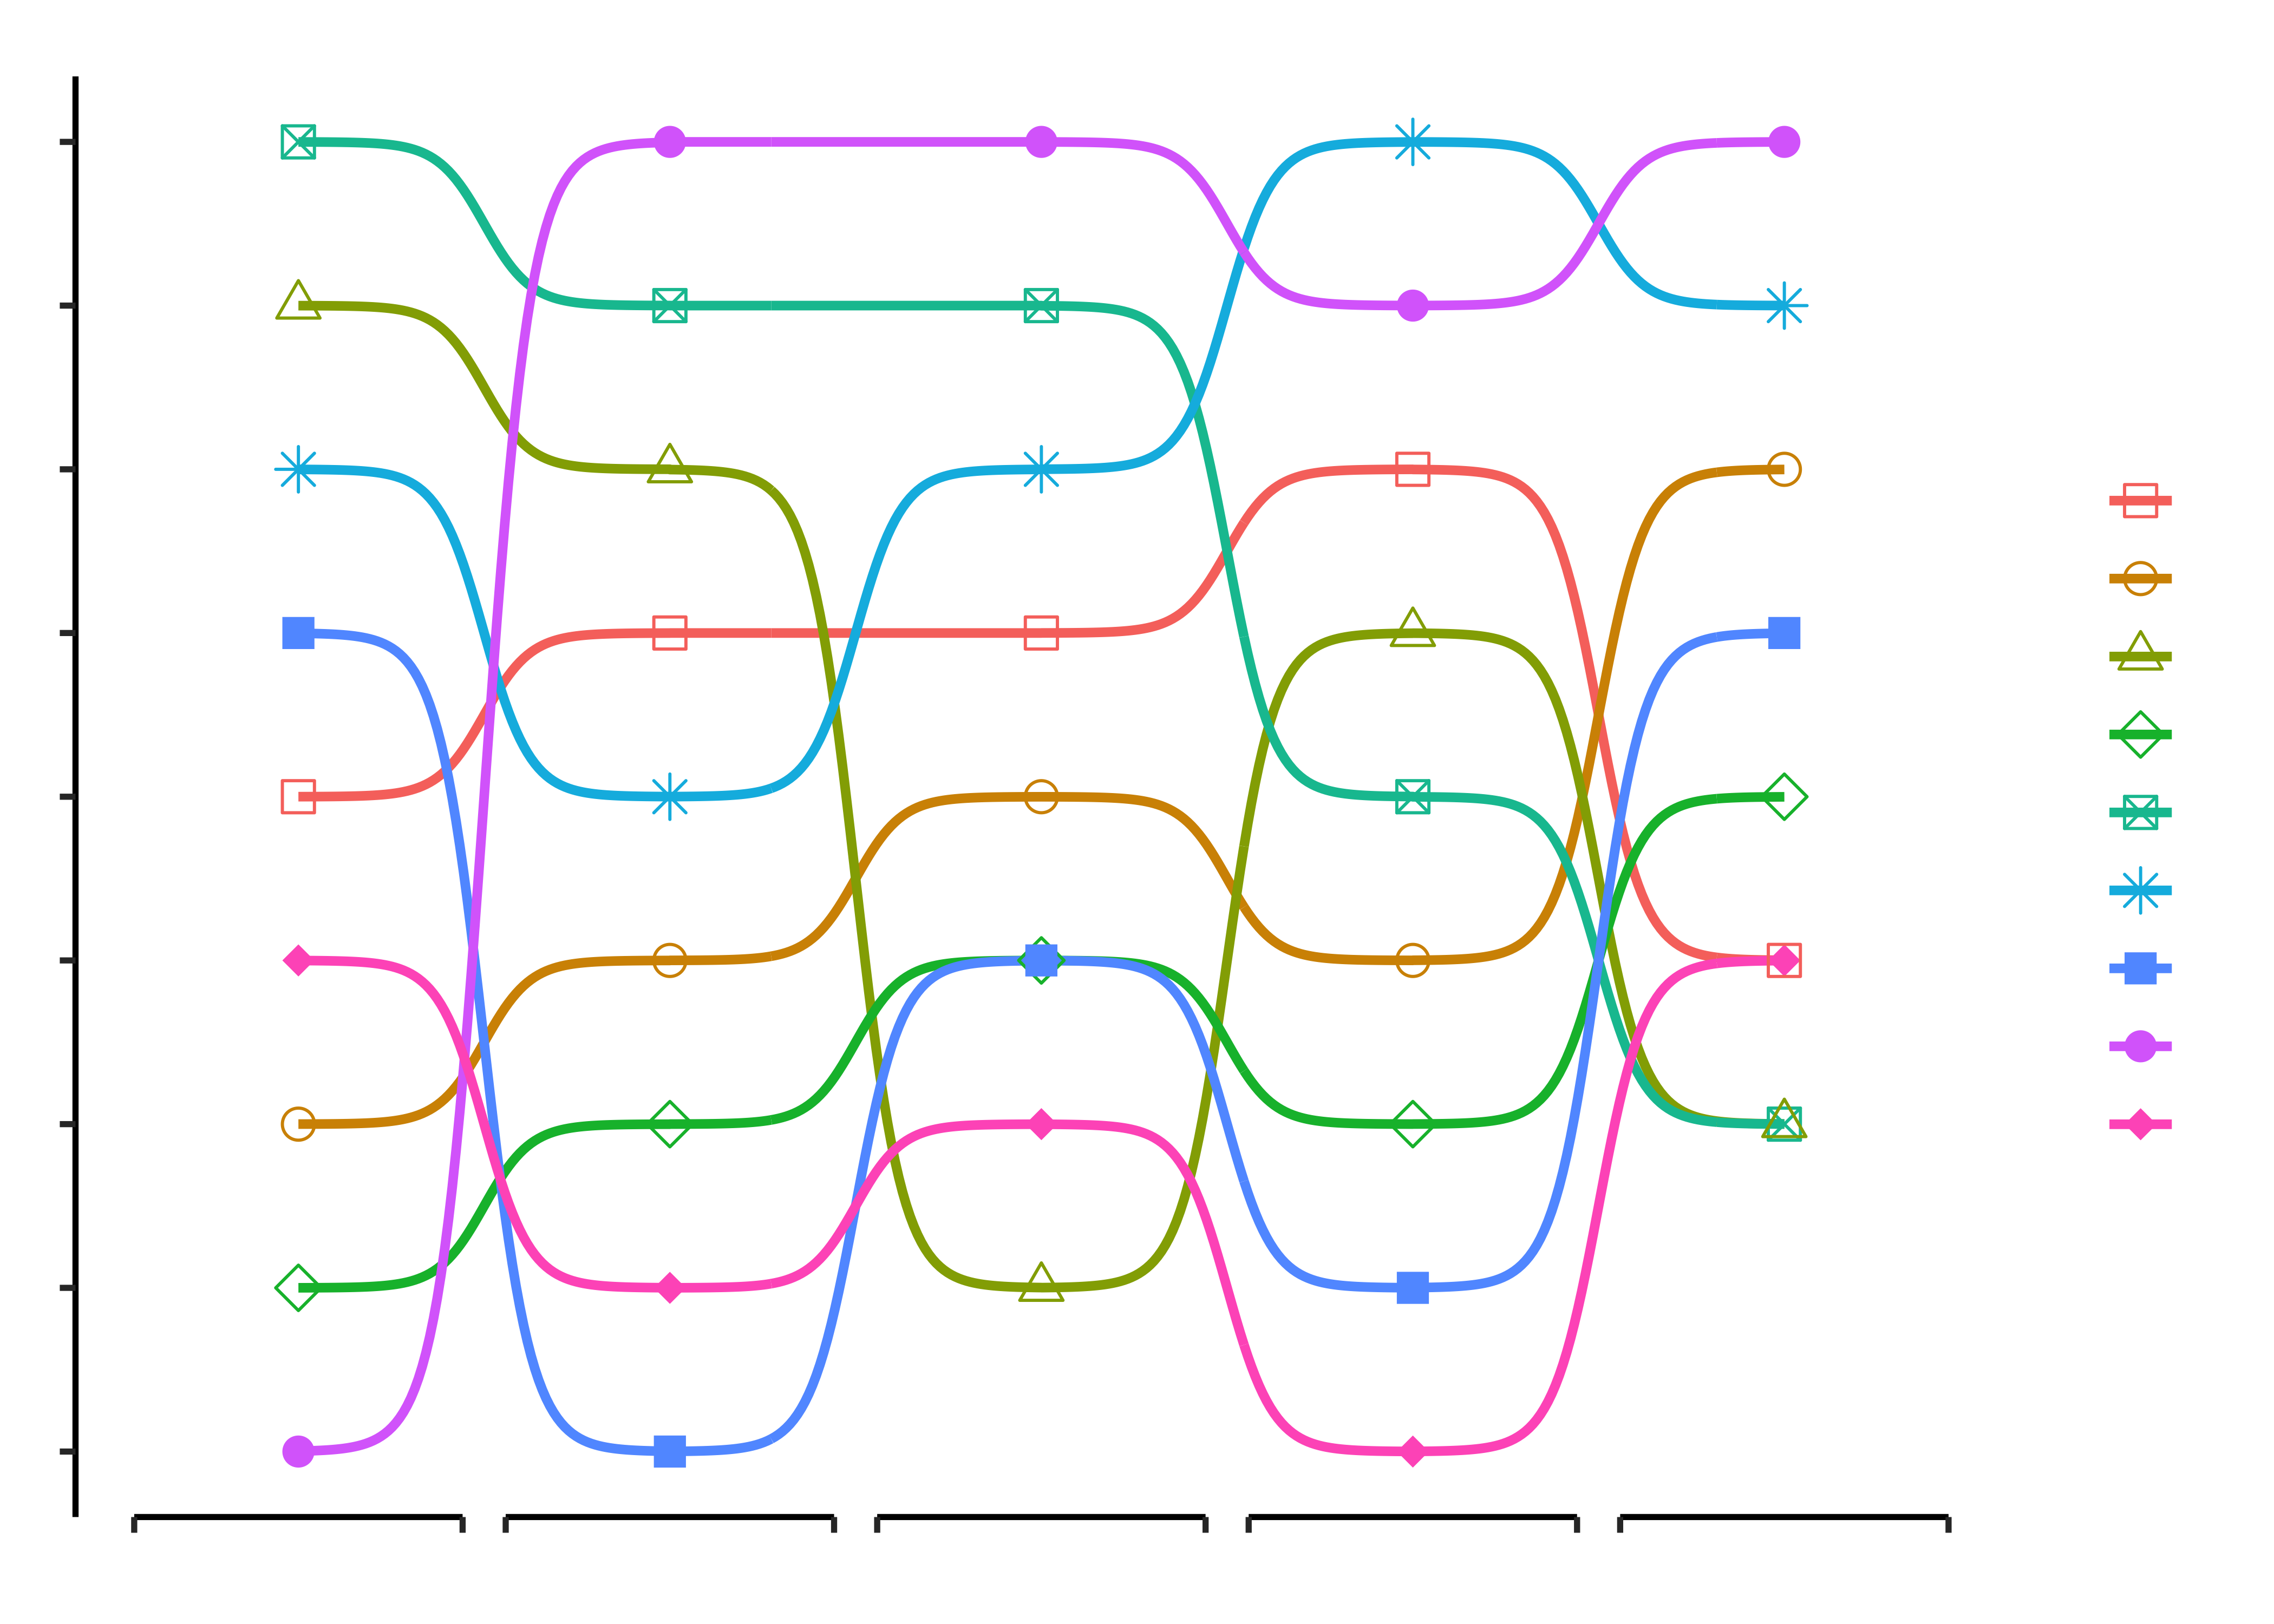
Nine types of Seaweed were rated on different parameters and charted as shown below.

NoteExcel Data

The data is an excel sheet. Inspect it first in Excel and decide which sheet you need, and which part of the data you need. There are multiple sheets! Then use readxl::read_xlsx(..) to read it into R.

Read the Data

Inspect the Data

Rows: 10
Columns: 18
$ `common name`     <chr> "RDA", "Norwegian Kelp", "Oarweed", "Thongweed", "Wa…
$ `sci-name`        <chr> NA, "-Ascophyllum nodosum", "-Laminaria digitata", "…
$ `total fats`      <chr> NA, "0.6", "-", "-", "0.6", "0.3", "-", "0.2", "-", …
$ `saturated fat`   <chr> NA, "0.2", "-", "-", "0.1", "0.1", "-", "0", "-", "-"
$ cholesterol       <chr> NA, "0", "0", "0", "0", "0", "0", "0", "0", "-"
$ protein           <chr> NA, "1.7", "-", "-", "3", "5.8", "-", "1.5", "-", "-"
$ `Total fiber`     <dbl> NA, 8.8, 6.2, 9.8, 3.4, 3.8, 5.4, 1.3, 3.8, 4.9
$ `Soluble fiber`   <chr> NA, "7.5", "5.4", "7.7", "2.9", "3", "3", "-", "2.1"…
$ `Insoluble fiber` <chr> NA, "1.3", "0.8", "2.1", "0.5", "1", "2.3", "-", "1.…
$ Carbohydrates     <dbl> NA, 13.1, 9.9, 15.0, 4.6, 5.4, 10.6, 12.0, 4.1, 7.8
$ Calcium           <dbl> NA, 575.0, 364.7, 30.0, 112.3, 34.2, 148.8, 373.8, 3…
$ Potassium         <dbl> NA, 765.0, 2013.2, 1351.4, 62.4, 302.2, 1169.6, 827.…
$ Magnesium         <dbl> NA, 225.0, 403.5, 90.1, 78.7, 108.3, 97.6, 573.8, 46…
$ Sodium            <dbl> NA, 1173.8, 624.6, 600.6, 448.7, 119.7, 255.2, 1572.…
$ Copper            <dbl> NA, 0.8, 0.3, 0.1, 0.2, 0.1, 0.4, 0.1, 0.3, 0.1
$ Iron              <dbl> NA, 14.9, 45.6, 5.0, 3.9, 5.2, 12.8, 6.6, 15.3, 22.2
$ Iodine            <dbl> NA, 18.2, 70.0, 10.7, 3.9, 1.3, 10.2, 6.1, 1.6, 97.9
$ Zinc              <chr> NA, "-", "1.6", "1.7", "0.3", "0.7", "0.3", "-", "0.…

Data Dictionary

NoteQuantitative Variables

Write in.

NoteQualitative Variables

Write in.

NoteObservations

Write in.

Research Question

Note

Write in!

Analyse/Transform the Data

```{r}
#| label: data-preprocessing
#
# Write in your code here
# to prepare this data as shown below
# to generate the plot that follows
```
ABCDEFGHIJ0123456789
common_name
<chr>
parameter
<chr>
ranks
<int>
Norwegian Kelpcalcium_rank1
Oarweedcalcium_rank3
Thongweedcalcium_rank9
Wakamecalcium_rank6
Noricalcium_rank8
Dulsecalcium_rank5
Irish Mosscalcium_rank2
Sea Lettucecalcium_rank4
Grass kelpcalcium_rank7
Norwegian Kelpcarbo_rank2
Next
12345
Previous
1-10 of 45 rows

Plot the Data

Warning: The S3 guide system was deprecated in ggplot2 3.5.0.
ℹ It has been replaced by a ggproto system that can be extended.

Tasks and Discussion

  • Complete the Data Dictionary.
  • Select and Transform the variables as shown.
  • Create the graphs shown and discuss the following questions:
    • Identify the type of charts
    • Identify the variables used for various geometrical aspects (x, y, fill…). Name the variables appropriately.
    • What research activity might have been carried out to obtain the data graphed here? Provide some details.
    • What might have been the Hypothesis/Research Question to which the response was Chart?
    • Write a 2-line story based on the chart, describing your inference/surprise.
    • Based on the diagram, discuss which one an elderly person might try if they are deficient in calcium. If you were trying to avoid carbs, which seaweed sushi would you try?
Back to top

License: CC BY-SA 2.0

Website made with ❤️ and Quarto, by Arvind V.

Hosted by Netlify .