
The Multilayer Perceptron
This was our bare bones Perceptron, or neuron as we will refer to it henceforth:
For the multi-layer perceptron, two changes were made:
Changing the hard-threshold activation into a more soft sigmoid activation
addition of (one or more ) hidden layers.
Let us discuss these changes in detail.
What is the Activation Block?
- We said earlier that the weighting and adding is a linear operation.
- While this is great, simple linear translations of data are not capable of generating what we might call learning or generalization ability.
- The outout of the perceptron is a “learning decision” that is made by deciding if the combined output is greater or smaller than a threshold.
- We need to have some non-linear block to allow the data to create nonlinear transformations of the data space, such as curving it, or folding it, or creating bumps, depressions, twists, and so on.
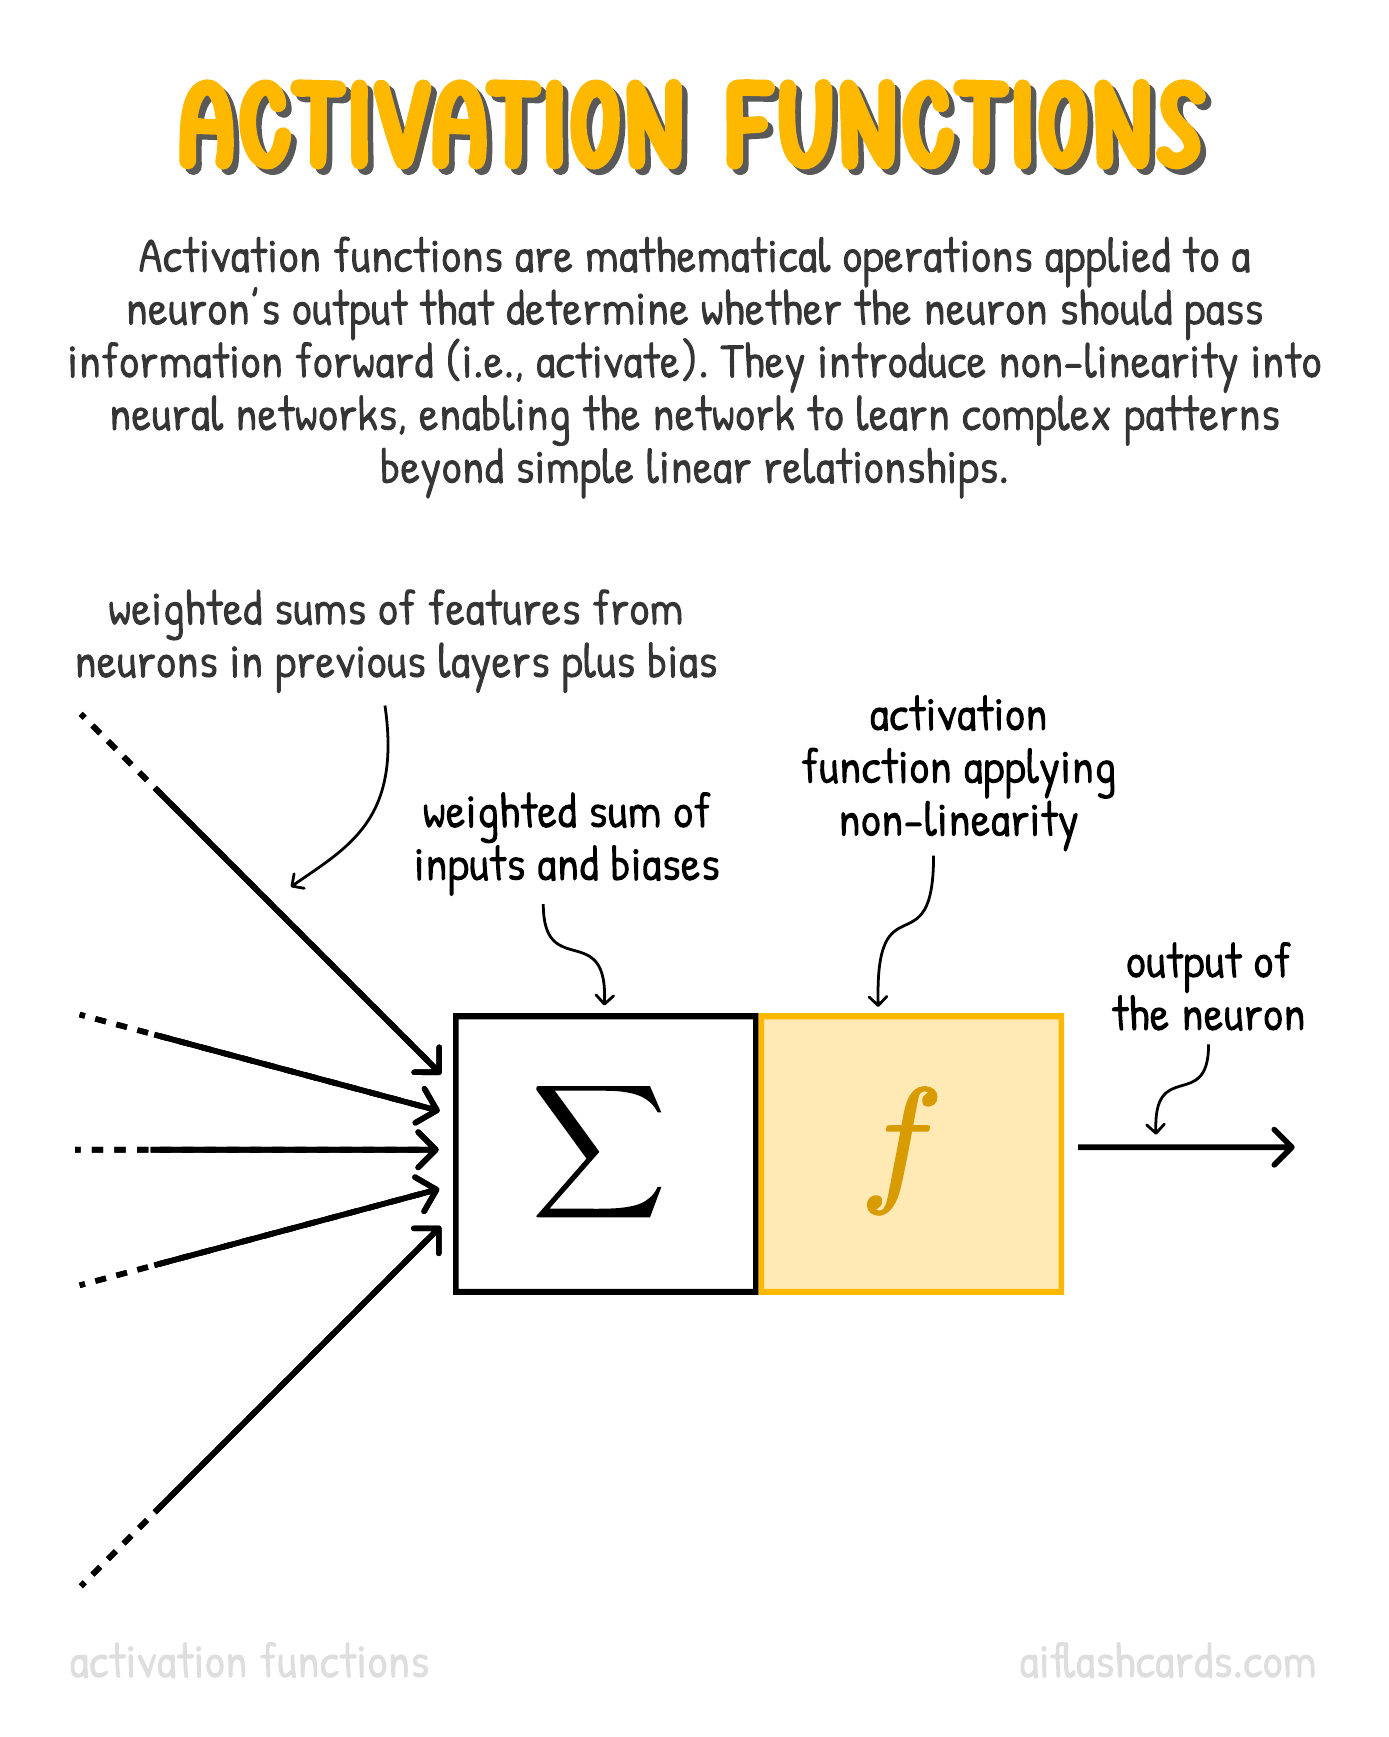
- This nonlinear function needs to be chosen with care so that it is both differentiable and keeps the math analysis tractable. (More later)
- Such a nonlinear mathematical function is implemented in the Activation Block.
- See this example: red and blue areas, which we wish to separate and classify these with our DLNN, are not separable unless we fold and curve our 2D data space.
- The separation is achieved using a linear operation, i.e. a LINE!!
- For instance in Figure 2, no amount of stretching or compressing of the surface can separate the two sets ( blue and red ) using a line or plane, unless the surface can be warped into another dimension by folding.
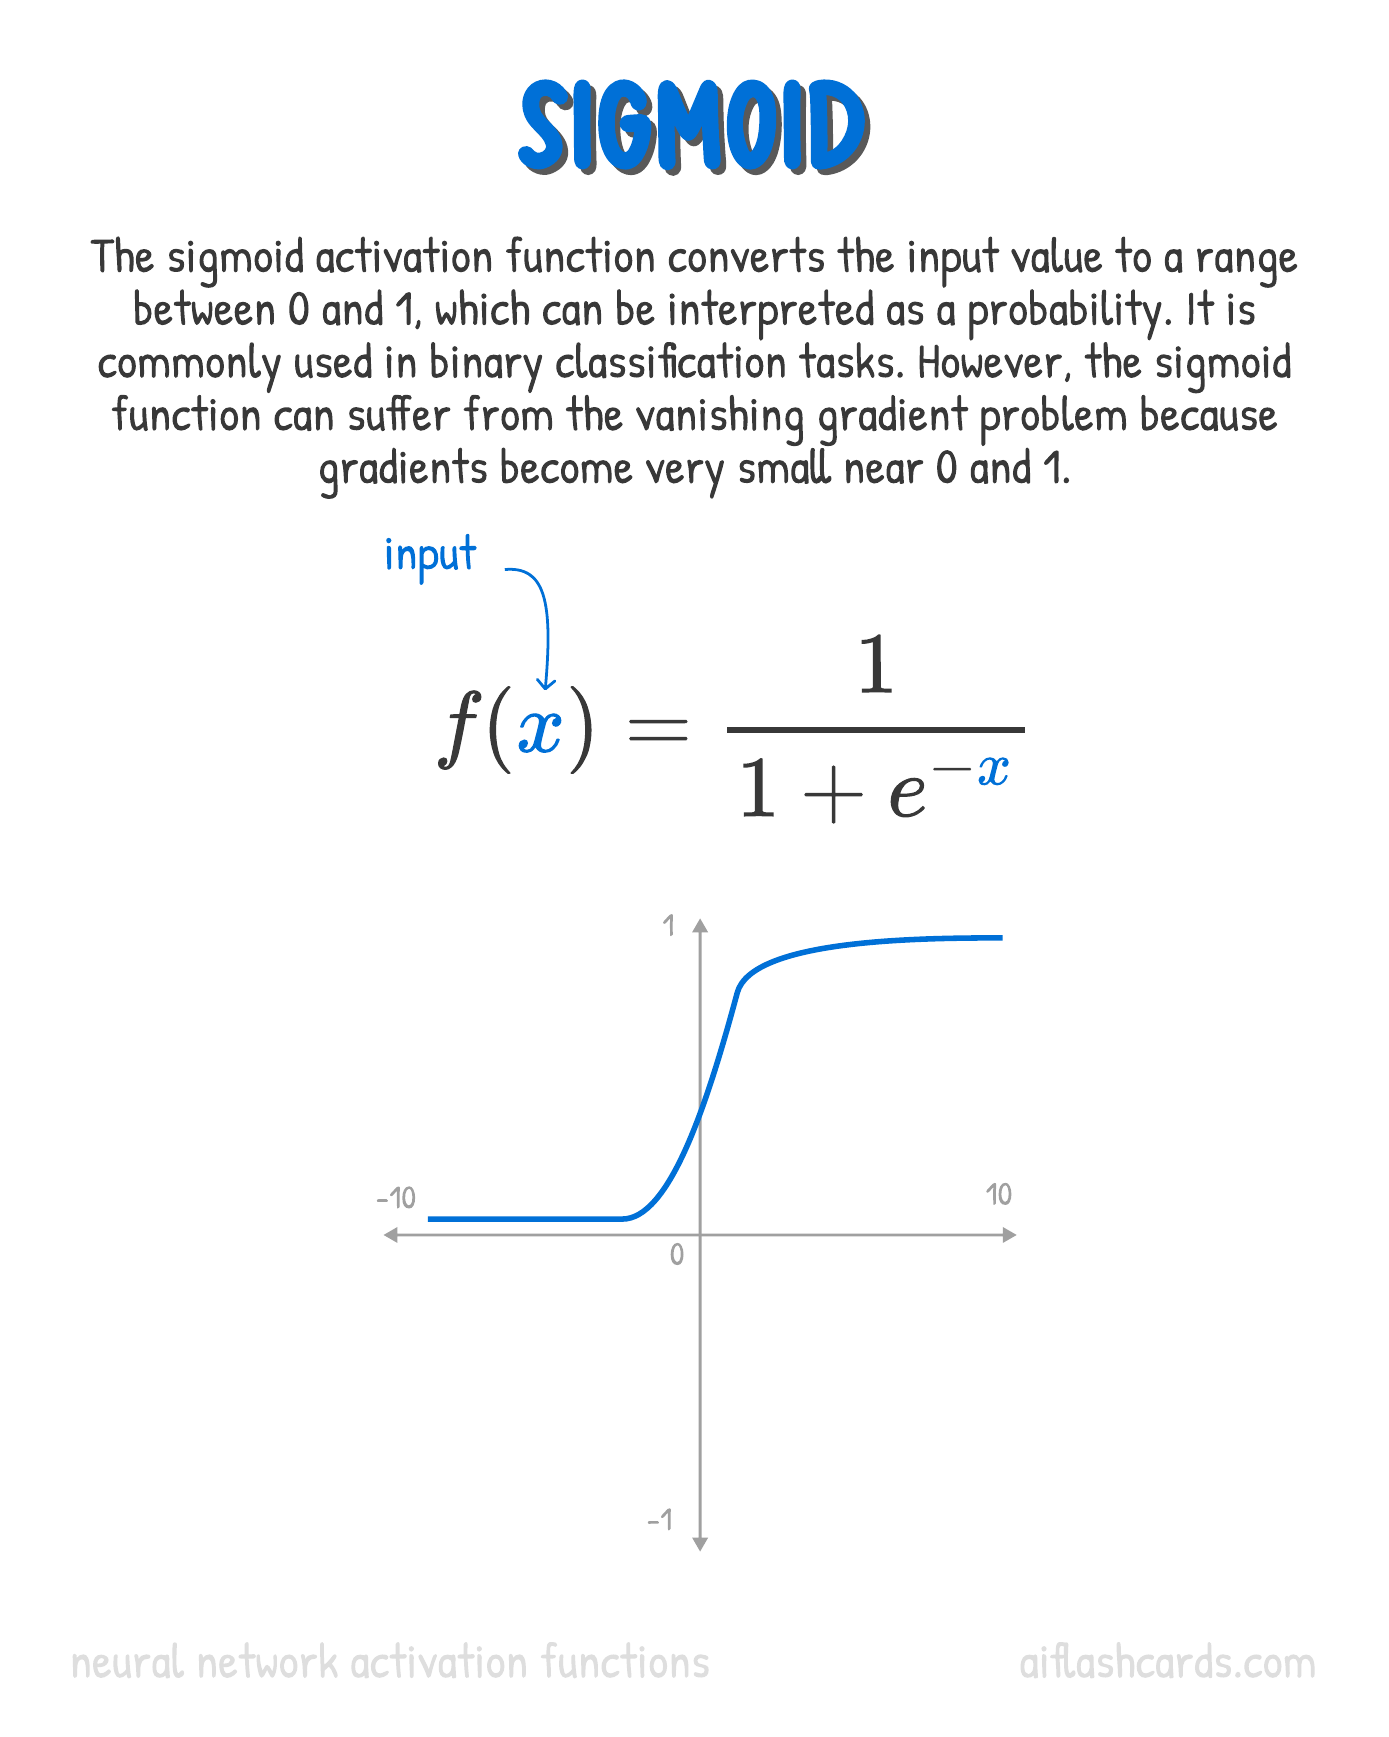
What is the Sigmoid Function?
The hard-threshold used in the Perceptron allowed us to make certain decisions based on linear combinations of the input data. But what is the dataset possesses classes that are not separable in a linear way? What if different categories of points are intertwined with a curved boundary between classes?
We need to have some non-linear block to allow the data to create nonlinear transformations of the data space, such as curving it, or folding it, or creating bumps, depressions, twists, and so on.
- This nonlinear function needs to be chosen with care so that it is both differentiable and keeps the math analysis tractable. (More later)
- Such a nonlinear mathematical function is implemented in the Activation Block.
- See this example: red and blue areas, which we wish to separate and classify these with our DLNN, are not separable unless we fold and curve our 2D data space.
- The separation is achieved using a linear operation, i.e. a LINE!!
- For instance in Figure 2, no amount of stretching or compressing of the surface can separate the two sets ( blue and red ) using a line or plane, unless the surface can be warped into another dimension by folding.
So how do we implement this nonlinear Activation Block?
- One of the popular functions used in the Activation Block is a function based on the exponential function
- Why? Because this function retains is identity when differentiated! This is a very convenient property!
Remembering Logistic Regression
Recall your study of Logistic Regression. There, the Sigmoid function was used to model the odds of the (Qualitative) target variable against the (Quantitative) predictor.
But Why Sigmoid?
Because the Sigmoid function is differentiable. And linear in the mid ranges. Oh, and remember the Chain Rule?


- The “vanilla” perceptron was big advance in AI and learning. However, it was realized that this can only make classification decisions with data that are linearly separable.
- Including a differentiable non-linearity in the activation block allows us to deform the coordinate space in which the data points are mapped.
- This deformation may permit unique views of the data wherein the categories of data are separable by an n-dimensional plane.
- This idea is also used in a machine learning algorithm called Support Vector Machines.
MLPs in Code
Using torch.
References
- Tariq Rashid. Make your own Neural Network. PDF Online
- Mathoverflow. Intuitive Crutches for Higher Dimensional Thinking. https://mathoverflow.net/questions/25983/intuitive-crutches-for-higher-dimensional-thinking
- 3D MatMul Visualizerhttps://bhosmer.github.io/mm/ref.html