Peeling Data Open
Introduction to Orange
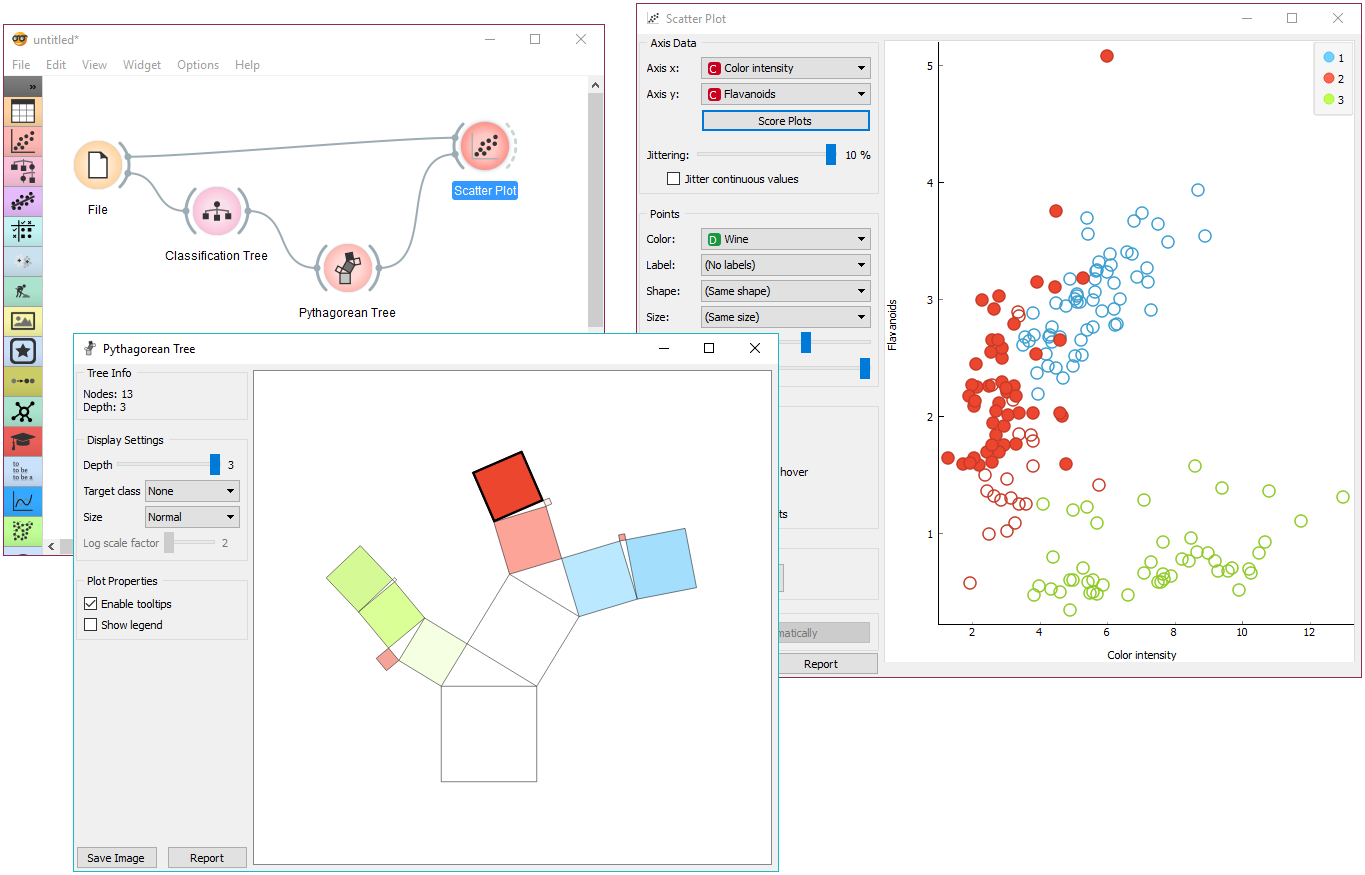
Orange is a visual drag-and-drop tool for
- Data visualization
- Statistical Tests
- Machine Learning
- Data mining
and much more. Here is what it looks like:
All operations are done using a visual menu-driven interface. We drag and drop widgets that can have inputs and outputs. Widgets perform operations on data sent to them by other widgets. The visuals can be exported to PNG/SVG/PDF and the entire workflow can be exported into a Report Form and edited for presentation and sharing.
Orange also has add-ons that provide widgets for specific tasks such as Machine Learning, Time Series Analysis and so on.
Installing Orange
You can download and install Orange from here:
Basic Usage of Orange
Orange Workflows
Widgets and Channels
Loading data into Orange
We are good to get started with Orange!!
Simple Visuals using Orange
Let us create some simple visualizations using Orange.
- Use the File Widget to import the
irisdataset into your session - Use the Data Table Widget to look at the data, and note its variable names
- Use the Visualization Widgets ( Scatter Plot, Bar Plot, and Distributions) to look at the properties of the variables, and examine relationships between them.
Reference
Introduction to Data Mining-Working notes for the hands-on course with Orange Data Mining.
Orange Data Mining Widget Catalog: Look here for help and guidance! https://orangedatamining.com/widget-catalog/
StackExchange Orange Forum. https://datascience.stackexchange.com/questions/tagged/orange